HiveMQ Control Center v1 Analytics
The HiveMQ Control Center provides a wide range of analytics functionality to help you gain real-time insights into the health and performance of your HiveMQ deployment. Some key analytics features of the control center include:
-
Dashboards: Interactive and customizable dashboards for quick access to metrics and data from your HiveMQ brokers and clients.
-
Metrics: Comprehensive monitoring of key performance indicators such as client connections, inbound and outbound publish rates, and queued messages.
-
Notifications: Alerts and useful information updates on your HiveMQ cluster activity.
-
Logs: In addition to the unified HiveMQ audit log the client detail view of the HiveMQ Control Center provides a searchable event history for each client.
-
Visualization: Configurable graphic representations that visualize various aspects of your HiveMQ deployment such as percent of dropped messages per reason code.
| For production environments, we highly recommend the use of a full monitoring setup in addition to your HiveMQ Control Center. There are many commercially-available monitoring solutions to choose from. For more information on the ready-to-use extensions for popular monitoring solutions that HiveMQ offers, visit the HiveMQ Marketplace. |
Dropped Messages
The Dropped Messages view in your HiveMQ Control Center enables you to analyze all dropped messages on your HiveMQ broker. A dropped message is a message that the broker does not publish to the intended recipient for a variety of reasons. Dropped messages never leave the broker.
HiveMQ provides the following information for dropped messages:
-
The reasons why messages dropped. For more information, see Dropped messages by reason.
-
The clients for which messages dropped. For more information, see Clients with dropped messages.
-
The shared subscription groups for which messages dropped. For more information, see Shared subscription groups with dropped messages.
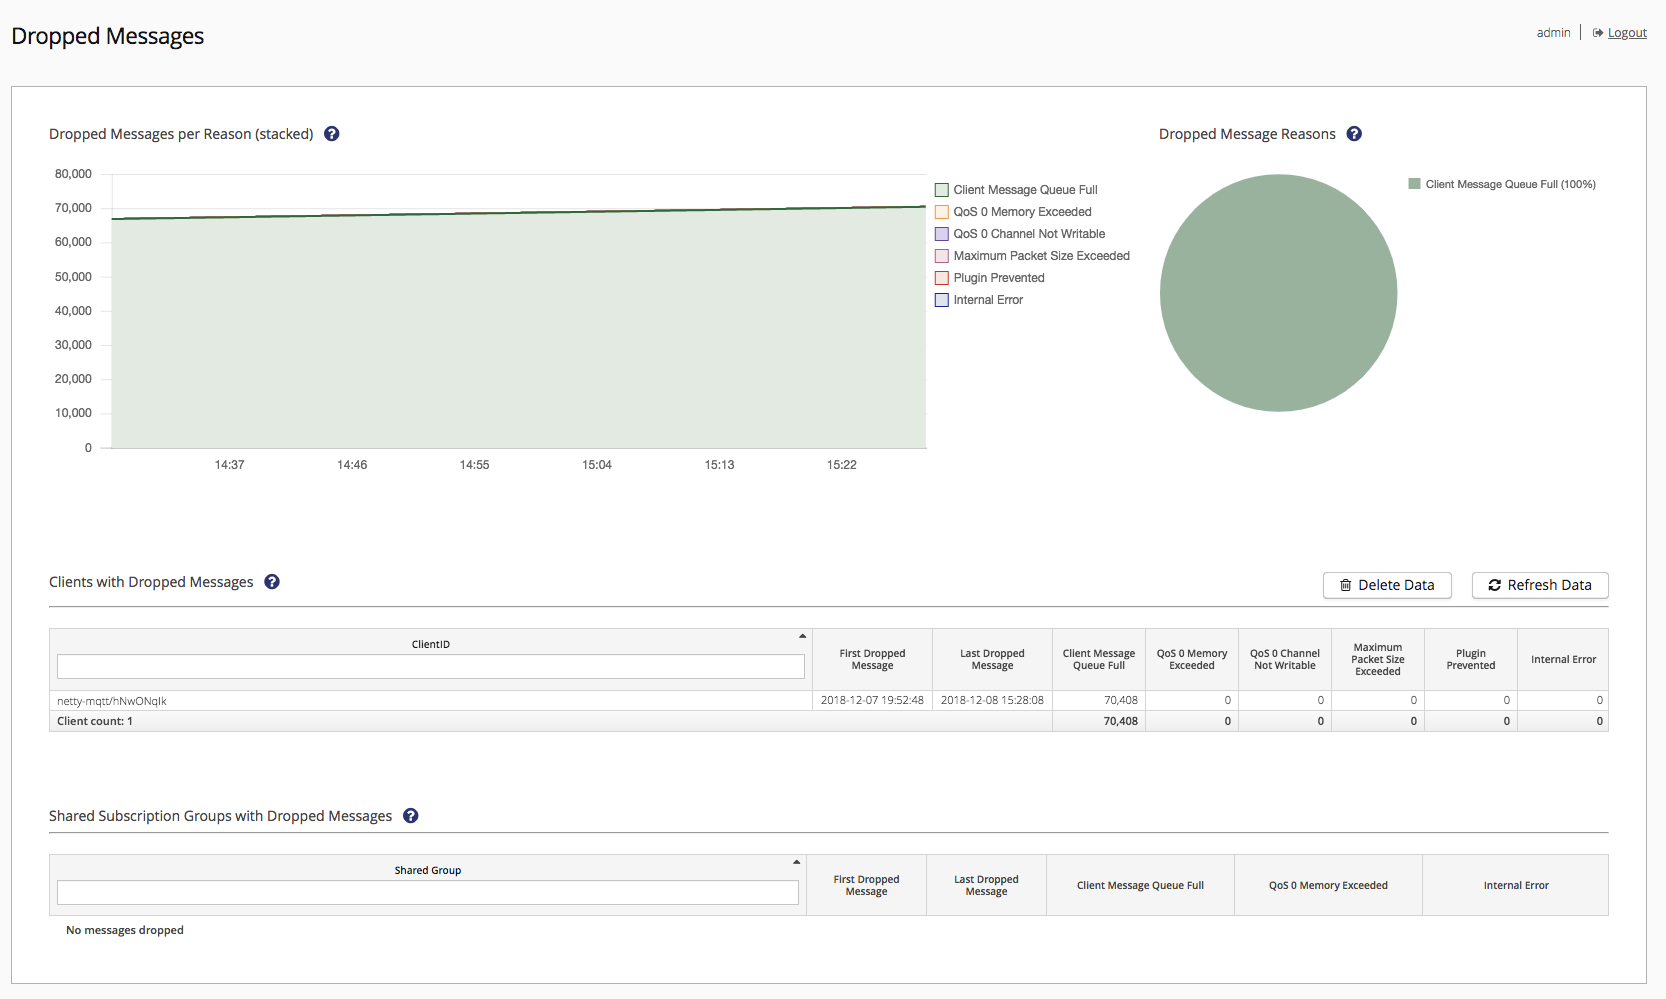
Dropped Messages by Reason
The Dropped Messages per Reason chart visualizes the causes and quantities of dropped messages on your broker over the last hour grouped by the reason.
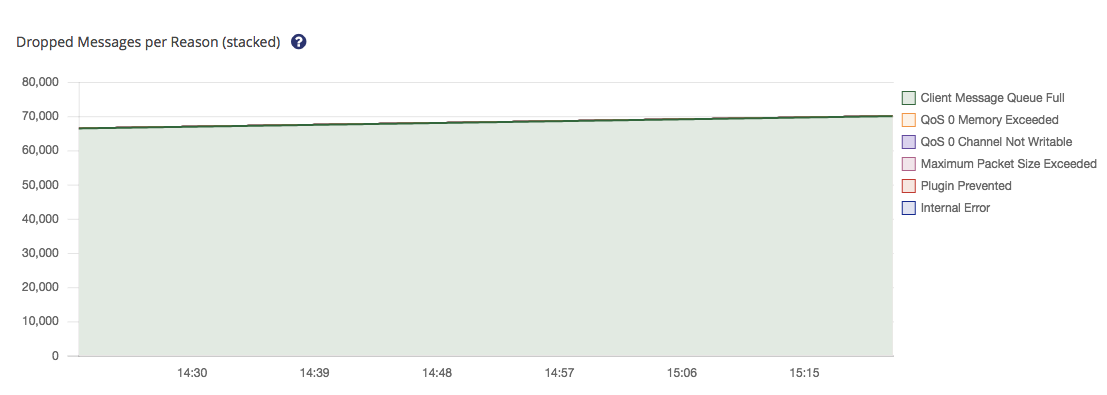
To adjust the reasons that are visible in the chart, select or deselect the reason in the legend of the chart.
Information automatically updates every 10 seconds.
The dropped message pie chart visualizes the total count and the percentage for each dropped message reason.
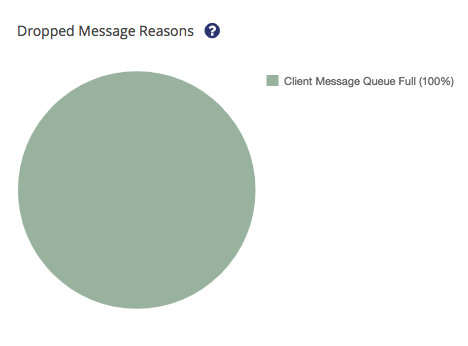
To view or hide a reason, select the reason in the legend of the chart.
Dropped Messages Reasons
Your HiveMQ broker can drop a message for the following reasons:
| Reason | Description |
|---|---|
Client’s message queue was full as another message for that client arrived. |
|
Broker wide memory for queueing Quality of Service 0 messages has been exceeded. |
|
Quality of Service 0 could not be delivered because it was impossible to write to the client socket |
|
Message size was bigger than the maximum size of the receiving client |
|
Message delivery was prevented by a publish inbound interceptor or publish outbound interceptor. |
|
Messages that were dropped because of internal errors. |
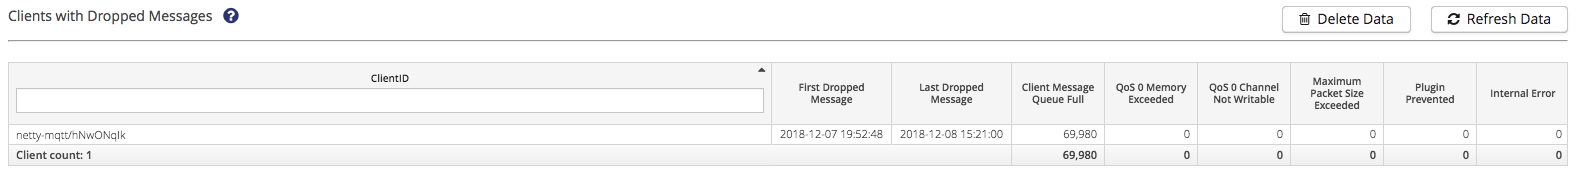
Dropped Messages by Client
The Clients with Dropped Messages overview shows the first 100 clients per node that dropped messages over the last four days:
| Column | Descriptions |
|---|---|
ClientID |
The ID of the client that dropped messages |
First Dropped Message |
The timestamp of the first message the client dropped |
Last Dropped Message |
The timestamp of the last message the client dropped |
Indicates that the message queue of the client was already full when the new message for the client arrived. |
|
Indicates that the broker-wide memory for queueing Quality of Service level 0 (QoS 0) messages has been exceeded. |
|
Indicates that the QoS 0 message could not be delivered because it was impossible to write to the client socket. |
|
Indicates that the size of the incoming message exceeded the maximum message size the client allows. |
|
Indicates that a publish inbound interceptor or publish outbound interceptor of an extension prevented delivery of the message. |
|
Indicates that an internal error in the broker prevented message delivery. |
The columns in the overview can be sorted in ascending or descending order and filtered by the client ID.
To open the Client Detail View of a client, select the client name. To clear all data shown in the detail view, select Clear Data. To refresh the data shown in the detail view, select Refresh Data.
Dropped Messages by Shared Subscription Groups
The Dropped Messages by Shared Subscription Groups overview shows the first 100 shared groups that have dropped messages over the last four days.

| Column | Descriptions |
|---|---|
Shared Group |
The ID of the client that dropped messages |
First Dropped Message |
The timestamp of the first message the client dropped |
Last Dropped Message |
The timestamp of the last message the client dropped |
The message queue of the client was full when another message for that client arrived. |
|
Broker-wide memory for queueing Quality of Service 0 messages has been exceeded. |
|
Messages that were dropped because of internal errors. |
Detailed explanation of the reasons
For most use cases, message delivery must be as reliable as possible and the dropping of messages is not a desired outcome.
However, this does not mean that every dropped message represents a problem that requires your immediate attention.
The HiveMQ Control Center offers an in-depth look into why messages are dropped and for which clients.
The following information outlines some possible causes of dropped messages and offers insights for debugging purposes.
Client Message Queue Full
The client message queue full reason indicates that the internal message queue of the client for incoming messages that are not yet processed has reached its maximum capacity.
If your clients frequently experience this kind of dropped message, it can mean that your clients are not able to process received messages fast enough or that the network connection of the client is very unstable.
QoS 0 Memory Exceeded
Message queueing can occur when a client with a persistent session is temporarily offline or when the broker sends messages faster than the client can consume the messages.
When the broker receives messages with Quality of Service 0 (QoS 0), the broker puts the message into a global in-memory queue to await delivery to the intended client.
If the size of the QoS 0 queue exceeds the configured memory limit of the broker, additional incoming QoS 0 messages are dropped.
If your clients frequently experience this kind of dropped message, it can indicate that your clients are consuming messages too slowly, that clients have unstable network connections, or that your broker is not configured with sufficient memory.
| You can configure how many messages your HiveMQ broker is allowed to queue per client and how received messages that exceed the maximum queue size are handled. For more information, see Queued Messages. |
QoS 0 Channel Not Writable
When the broker receives a message with QoS 0 and the socket of the intended receiving client cannot be written to, the broker drops the message.
This drop reason can indicate that the client is unable to read messages fast enough to keep up with the incoming messages.
Maximum Packet Size Exceeded
MQTT 5 allows you to set the maximum message packet size that an MQTT client accepts.
If a message exceeds the allowed maximum packet size of the receiving client, the broker drops the message.
A high number of this kind of dropped messages can indicate suboptimal coordination between your sending and receiving clients.
Extension Prevented
The use of a publish inbound interceptor or publish outbound interceptor in an extension allows you to prevent the onward delivery of specific messages.
When a publish inbound or publish outbound interceptor blocks delivery, the broker drops the message.
A best practice for extension development is to log and/or forward the reason for the delivery prevention to the intended client.
Internal Error
If an internal broker error occurs during the handling of a message, the broker drops the message.
The reason for the internal error is not specified.
Messages that drop due to an internal error indicate an unexpected underlying problem.
If you observe internal errors, check your HiveMQ log file for the referenced error or contact us for additional assistance.
Cluster Metrics
The dashboard of your HiveMQ Control Center provides a quick overview of the available cluster metrics and access to further metric details:

| Metric | Description |
|---|---|
Connections |
The current total number of active connections for all cluster nodes. |
Inbound Publish Rate |
The current total number of incoming PUBLISH packets per second for all cluster nodes |
Outbound Publish Rate |
The current total number of outgoing PUBLISH packets per second for all cluster nodes. |
Subscriptions |
The current number of subscriptions and replicas stored in the cluster. |
Retained Messages |
The current number of retained messages and replicas stored in the cluster. |
Queued Messages |
The current number of queued messages and replicas stored in the cluster. The queued messages count can include queued messages of clients with clean sessions that have already disconnected). |
Cluster Nodes |
The current number of nodes in the cluster. |
For more information, see Clustering MQTT.
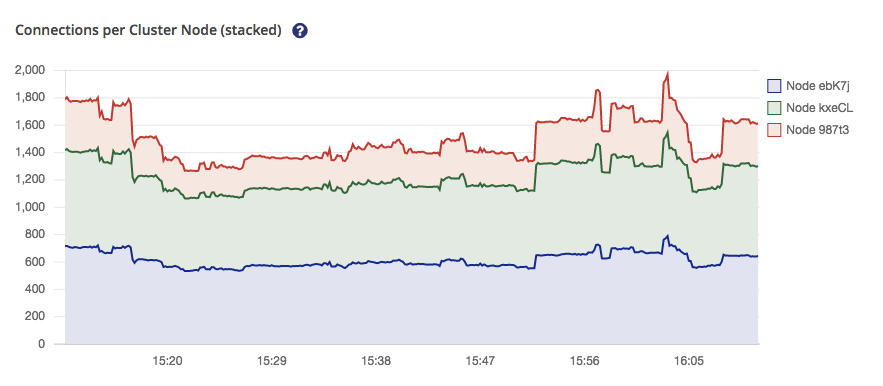
Detailed Metric View
Further information is available for each cluster metric the dashboard displays.
To open a more detailed visualization, click the thumbnail of the metric.
Details are provided for each node in the cluster.
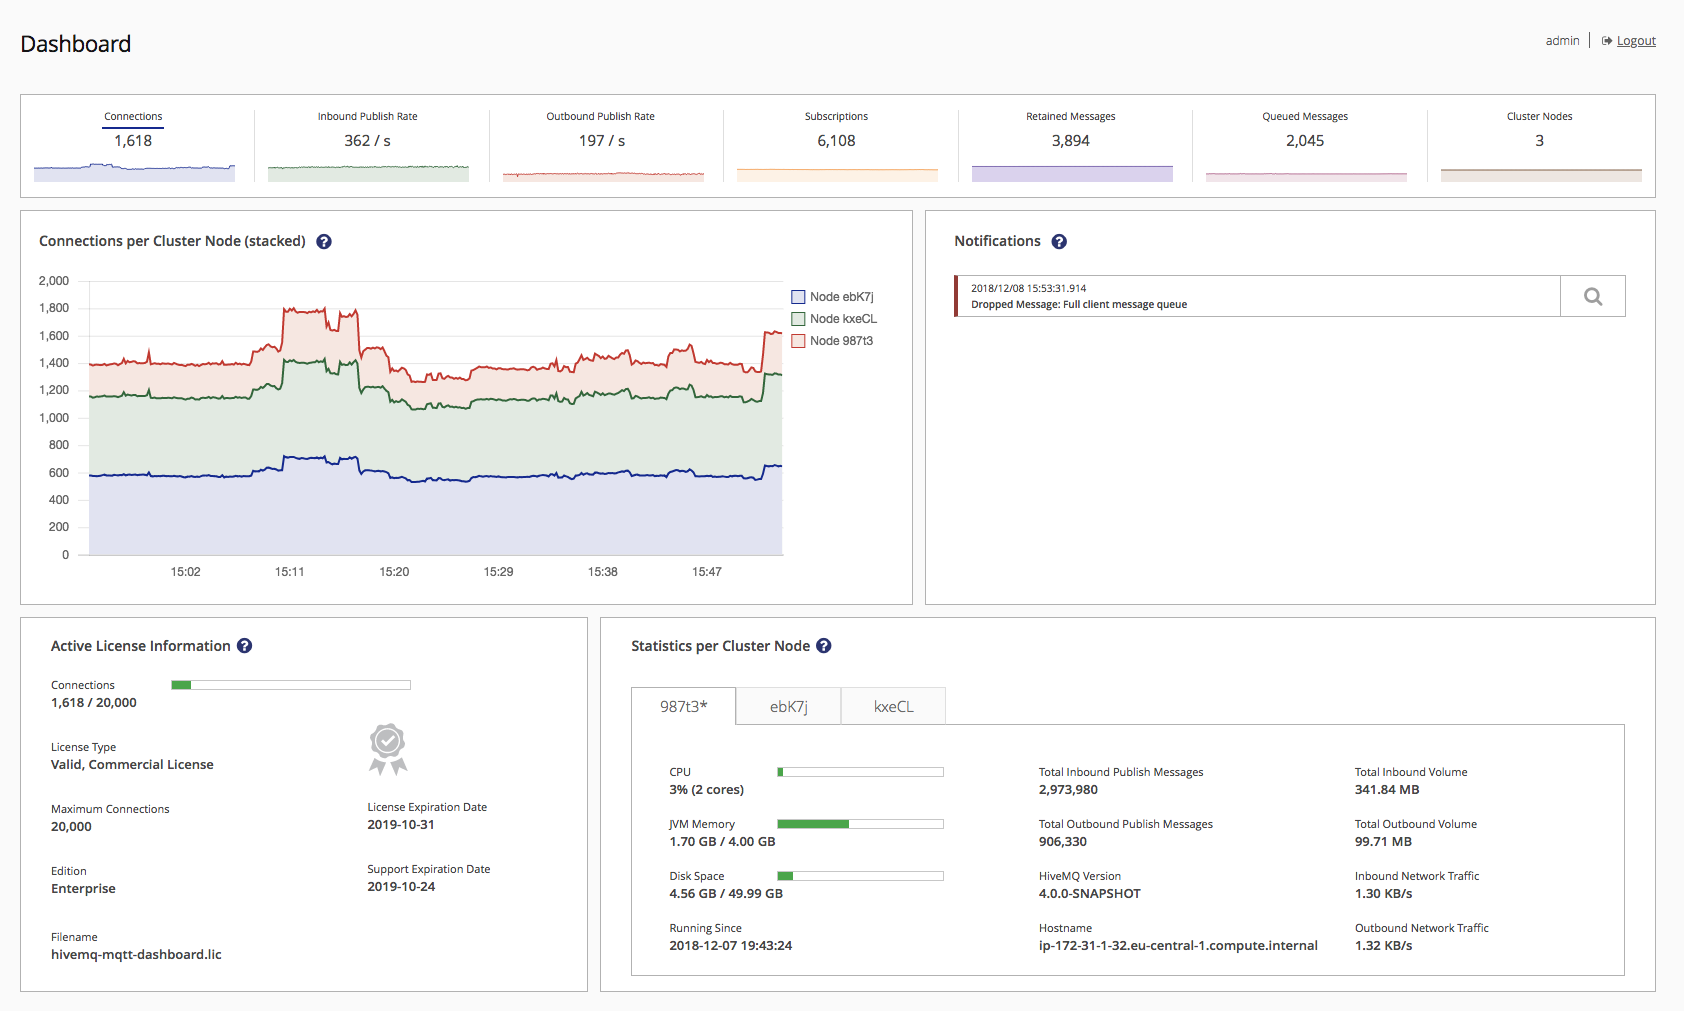
The name of the currently selected metric is underlined in the top section:
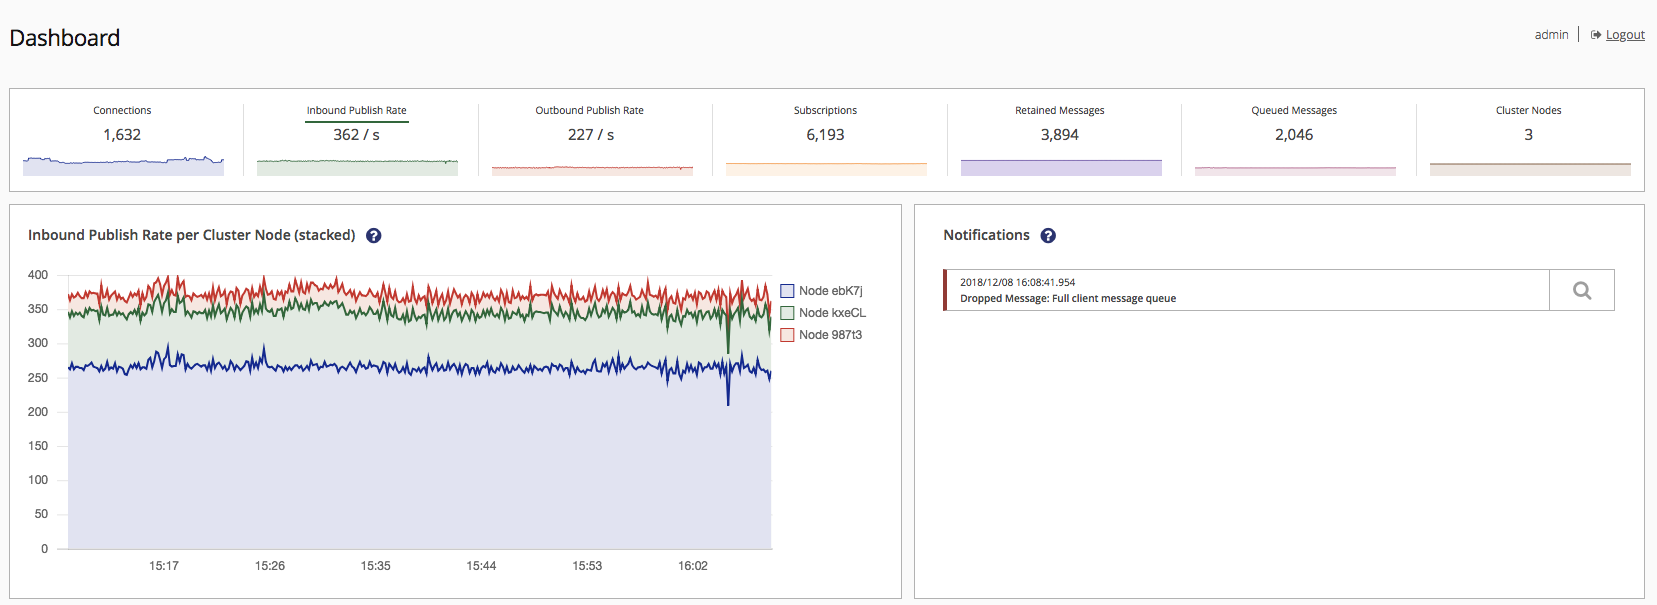
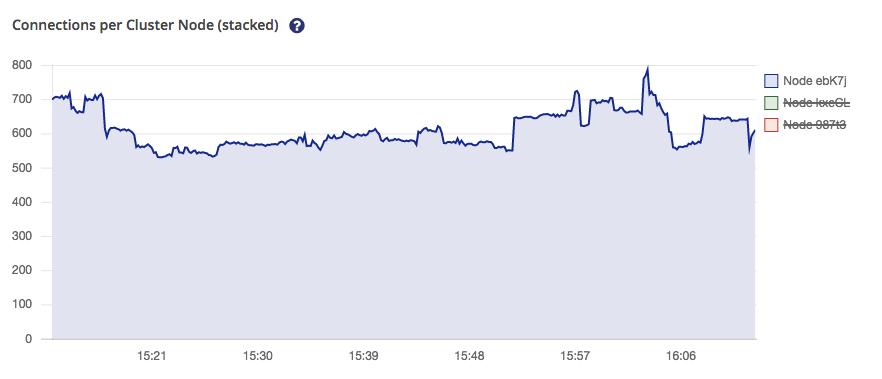
To view or hide individual nodes, select the name of the node in the legend. By default, all nodes are shown: