HiveMQ Cloud Metrics
The metrics HiveMQ exposes for your HiveMQ Cloud cluster vary based on your HiveMQ Cloud plan.
Metrics Overview
Each HiveMQ Cloud plan provides a different level of monitoring:
-
Starter: Access to essential metrics for basic monitoring and troubleshooting.
-
Enterprise: Comprehensive metrics including all Starter metrics plus advanced monitoring capabilities
HiveMQ Cloud Starter Metrics
Clusters on the HiveMQ Cloud Starter plan provide the following metrics:
| Metric | Type | Description |
|---|---|---|
|
|
Counts every closed connection that was closed because the client missed sending a PINGREQ message during the keep-alive interval |
|
|
The current number of queued messages for client sessions |
|
|
The current number of pending QoS 0 messages for client sessions |
|
|
The total number of pending messages for client sessions |
|
|
The number of PUBLISH messages that dropped because the message queue for a consumer topic was full |
|
|
The total number of dropped messages on the broker |
|
|
The number of PUBLISH messages that dropped because a Publish Inbound Interceptor prevented onward delivery |
|
|
The number of PUBLISH messages that dropped because of an internal error |
|
|
The number of PUBLISH messages that dropped because the message size was too large for the client |
|
|
The number of MQTT messages (excluding PUBLISH packets) that dropped because the message size was too large for the client |
|
|
The number of PUBLISH messages that dropped because the socket for the client was not writable (QoS 0 only) |
|
|
The number of PUBLISH messages that dropped because the global memory limit for QoS 0 messages was exceeded |
|
|
The number of PUBLISH messages that dropped because the message queue for a disconnected persistent session client was full |
|
|
The number of PUBLISH messages that are dropped because the message queue for a shared subscription is full |
|
|
The total number of expired messages on the broker |
|
|
Counts every incoming MQTT CONNECT message |
|
|
Counts every incoming MQTT PUBLISH message |
|
|
Counts every outgoing MQTT PUBLISH message |
|
|
The current total number of active MQTT connections |
|
|
Total number of normalized messages |
|
|
Counts the amount of publish messages received, without any matching subscribers |
|
|
The current number of active persistent sessions (= Online MQTT clients which are connected with cleanSession=false) |
|
|
The current number of subscriptions on the broker |
|
|
The number of connected clients to which at least one non-terminated behavior is currently applied |
|
|
The total number of failed terminations of behaviors |
|
|
The total number of successful terminations of behaviors |
|
|
The total number of failed schema deserializations in behavior policies |
|
|
The total number of successful schema deserializations in behavior policies |
|
|
The total number of behavior states initialized for all clients |
|
|
The number of PUBLISH messages that are dropped because a policy prevented onward delivery |
|
|
The total number of payloads that failed to validate successfully |
|
|
The total number of payloads that validated successfully |
|
|
The total number of policies that had a failed outcome |
|
|
The total number of policies that had a successful outcome |
|
|
The total number of failed schema validations |
|
|
The total number of successful schema validations |
|
|
The total number of validators that had a failed outcome |
|
|
The total number of validators that had a successful outcome |
|
|
The current number of loaded scripts in the script engine |
|
|
The current number of shared subscriptions on the broker |
|
|
The total number of records the extension cannot produce to Kafka |
|
|
The total number of records the extension ignored |
|
|
The total number of records that were retried to be produced to Kafka |
|
|
The total number of records the extension attempted to send to Kafka |
|
|
The total number of records the extension successfully produced to Kafka |
|
|
The total number of messages the extension drops from MQTT to Google Cloud Pub/Sub |
|
|
The total number of MQTT to Google Cloud Pub/Sub messages the extension cannot successfully forward |
|
|
The total number of MQTT to Google Cloud Pub/Sub messages the extension ignores |
|
|
The total number of MQTT to Google Cloud Pub/Sub messages the extension resends |
|
|
The total number of MQTT to Google Cloud Pub/Sub messages the extension sends |
|
|
The total number of MQTT to Google Cloud Pub/Sub messages from all transformers and mappings that the extension successfully forwards |
HiveMQ Cloud Enterprise Metrics
In addition to all Starter metrics, HiveMQ Cloud Enterprise offers the following advanced monitoring metrics:
Additional HiveMQ Cloud Enterprise Metrics
| Metric | Type | Description |
|---|---|---|
|
|
Counts every incoming MQTT 3 CONNECT message |
|
|
Counts every incoming MQTT 5 CONNECT message |
|
|
Counts every incoming MQTT PUBLISH message that is sent with quality of service (QoS) level 0 |
|
|
Counts every incoming MQTT PUBLISH message that is sent with quality of service (QoS) level 1 |
|
|
Counts every incoming MQTT PUBLISH message that is sent with quality of service (QoS) level 2 |
|
|
Counts every outgoing MQTT PUBLISH message that is sent with quality of service (QoS) level 0 |
|
|
Counts every outgoing MQTT PUBLISH message that is sent with quality of service (QoS) level 1 |
|
|
Counts every outgoing MQTT PUBLISH message that is sent with quality of service (QoS) level 2 |
|
|
The current number of queued messages |
|
|
The current (last 5 seconds) amount of read bytes |
|
|
The current (last 5 seconds) amount of written bytes |
HiveMQ Cloud Enterprise Dead Messages Queue Metrics
| Metric | Type | Description |
|---|---|---|
|
|
The total number of dead messages the broker detects |
|
|
The number of dead messages that are queued to a dead topic |
|
|
The number of dead messages that are dead more than once |
|
|
The number of dead messages that are dropped |
|
|
The number of dead messages that are expired |
HiveMQ Cloud Enterprise Dropped Messages Topic Metrics
| Metric | Type | Description |
|---|---|---|
|
|
The number of messages that are dead |
|
|
The number of messages that dropped due to queue limits |
|
|
The number of messages that originate from clients |
|
|
The number of messages that originate from shared subscriptions |
|
|
The number messages that originate from consumers |
|
|
The number of messages that are enqueued for a topic |
HiveMQ Cloud Enterprise Expired Messages Topic Metrics
| Metric | Type | Description |
|---|---|---|
|
|
The number of expired messages that are dead |
|
|
The number of expired messages that are dropped due to queue limits |
|
|
The number of expired messages that expire more than once |
|
|
The number of expired messages that are enqueued for an expired topic |
HiveMQ Cloud Enterprise Data Hub Metrics
| Metric | Type | Description |
|---|---|---|
|
|
The current number of policy entries in the behavior policy persistence |
|
|
The total number of state transitions behaviors perform |
|
|
The current number of data policy entries in the persistence |
|
|
The current amount of schema entries in the persistence |
|
|
The current number of script entries in the persistence |
HiveMQ Cloud OpenAPI Reference
For a detailed API reference, see: OpenAPI
Access HiveMQ Broker Metrics From a Remote Service
To retrieve raw metrics from a service, follow these steps:
Generate an API Token
-
Log into the HiveMQ Cloud web console, navigate to API Access in the top navigation of your HiveMQ Cloud cluster, and select Create new token.
-
On the Create API Token page, enter a unique name for the new token in the Token name field.
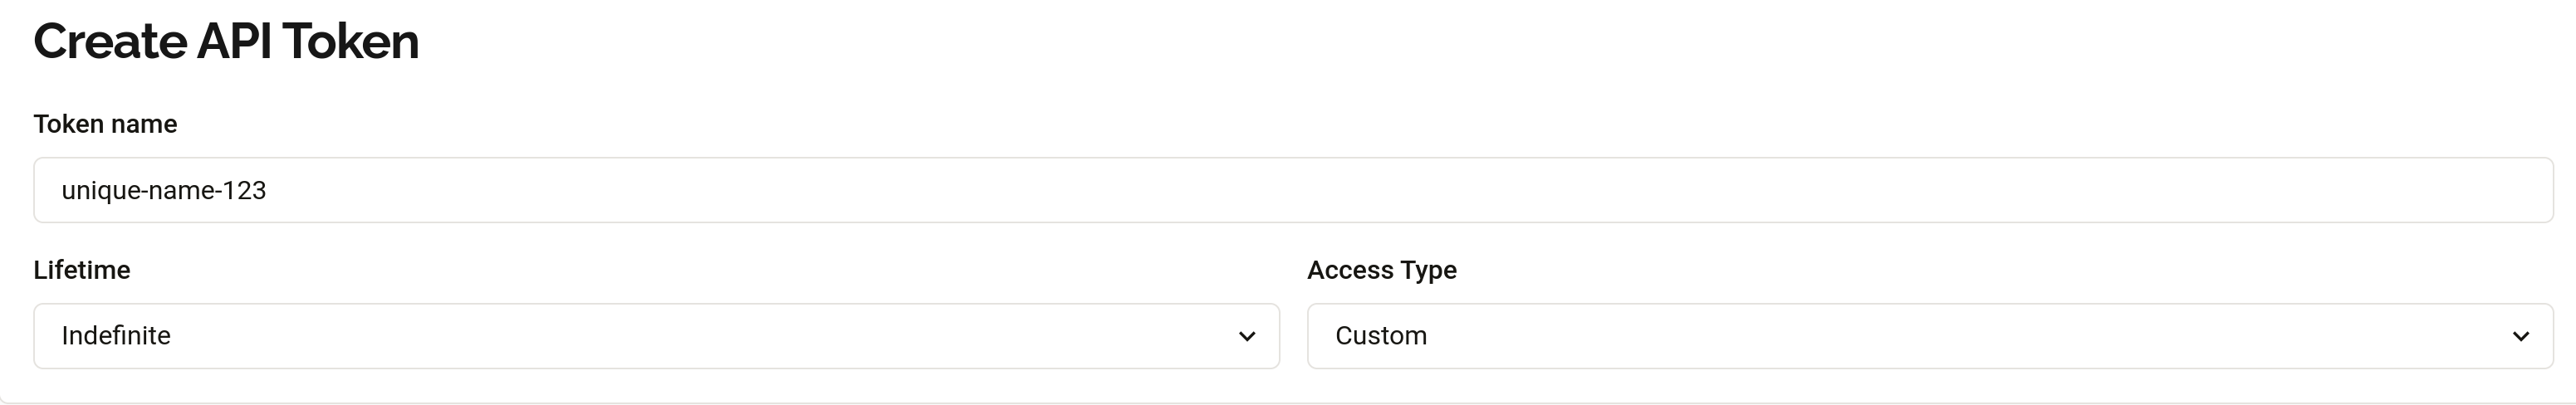
-
In the Access Type field select Custom.
-
From the Custom permissions options, select the Read and Otel metrics custom permissions.
-
To generate the new API token, select Create API token.
-
On the API Access overview, select Copy Token.
| Make sure to copy your token. Once you leave the API page, you will be unable to copy the token. |
Make an API Call
-
To retrieve your broker metrics in your own environment, copy the following command:
curl -v https://${YOUR_REST_API_BASE_URL}/metrics -H "Authorization: Bearer ${TOKEN}" -
Then, paste the command in your editor and modify the command with the following substitutions:
-
Replace
https://${YOUR_REST_API_BASE_URL}with the REST API BASE URL value provided on the API Access tab of your cluster. -
Replace
${TOKEN}in the command with the API token you generated and copied in the previous steps.
-
-
Now, run the command. This command returns the current metrics from the broker.
Integrating HiveMQ Broker Metrics into Prometheus
To collect and monitor HiveMQ Cloud metrics in Prometheus, follow these steps:
-
Edit your Prometheus configuration (
prometheus.yml) -
Add the following scrape job:
scrape_configs:
  - job_name: 'hivemq'
    metrics_path: '${PATH_TO_METRICS_ENDPOINT}/metrics'
    scheme: https
    static_configs:
      - targets:
        - '${YOUR_REST_API_URL}'
    bearer_token: '${TOKEN}'
Here is an example configuration:
scrape_configs:
  - job_name: 'hivemq'
    metrics_path: '/api/v2/orgs/rngipm/clusters/551f55b3-3026-420c-8908-95e958905055/metrics'
    scheme: https
    static_configs:
      - targets:
          - 'api.a01.euc1.aws.hivemq.cloud'
    bearer_token: 'eyJ...'
${PATH_TO_METRICS_ENDPOINT} is part of the REST API BASE URL provided on the API Access tab of your cluster.
${YOUR_REST_API_URL} is also provided on the API Access tab of your cluster.