HiveMQ Control Center v2: Overview Dashboard
The Overview dashboard offers a concise view of the current state of your HiveMQ Platform cluster. This information provides immediate insights into key issues and allows you to quickly check the state of each available cluster node.
The Nodes dropdown menu on your dashboard determines which data is displayed on the overview. The default ALL Nodes setting provides data for every node on your HiveMQ Platform cluster. To view data for a specific cluster node, select the node identifier from the list of available nodes in the Nodes dropdown menu.
For quick reference, the license block at the top right of the dashboard provides basic information about the license currently in use.
| To access detailed information on all licenses associated with your HiveMQ installation and the features your active license enables, open the License view from the main navigation. For more information, see Support | Licenses. |
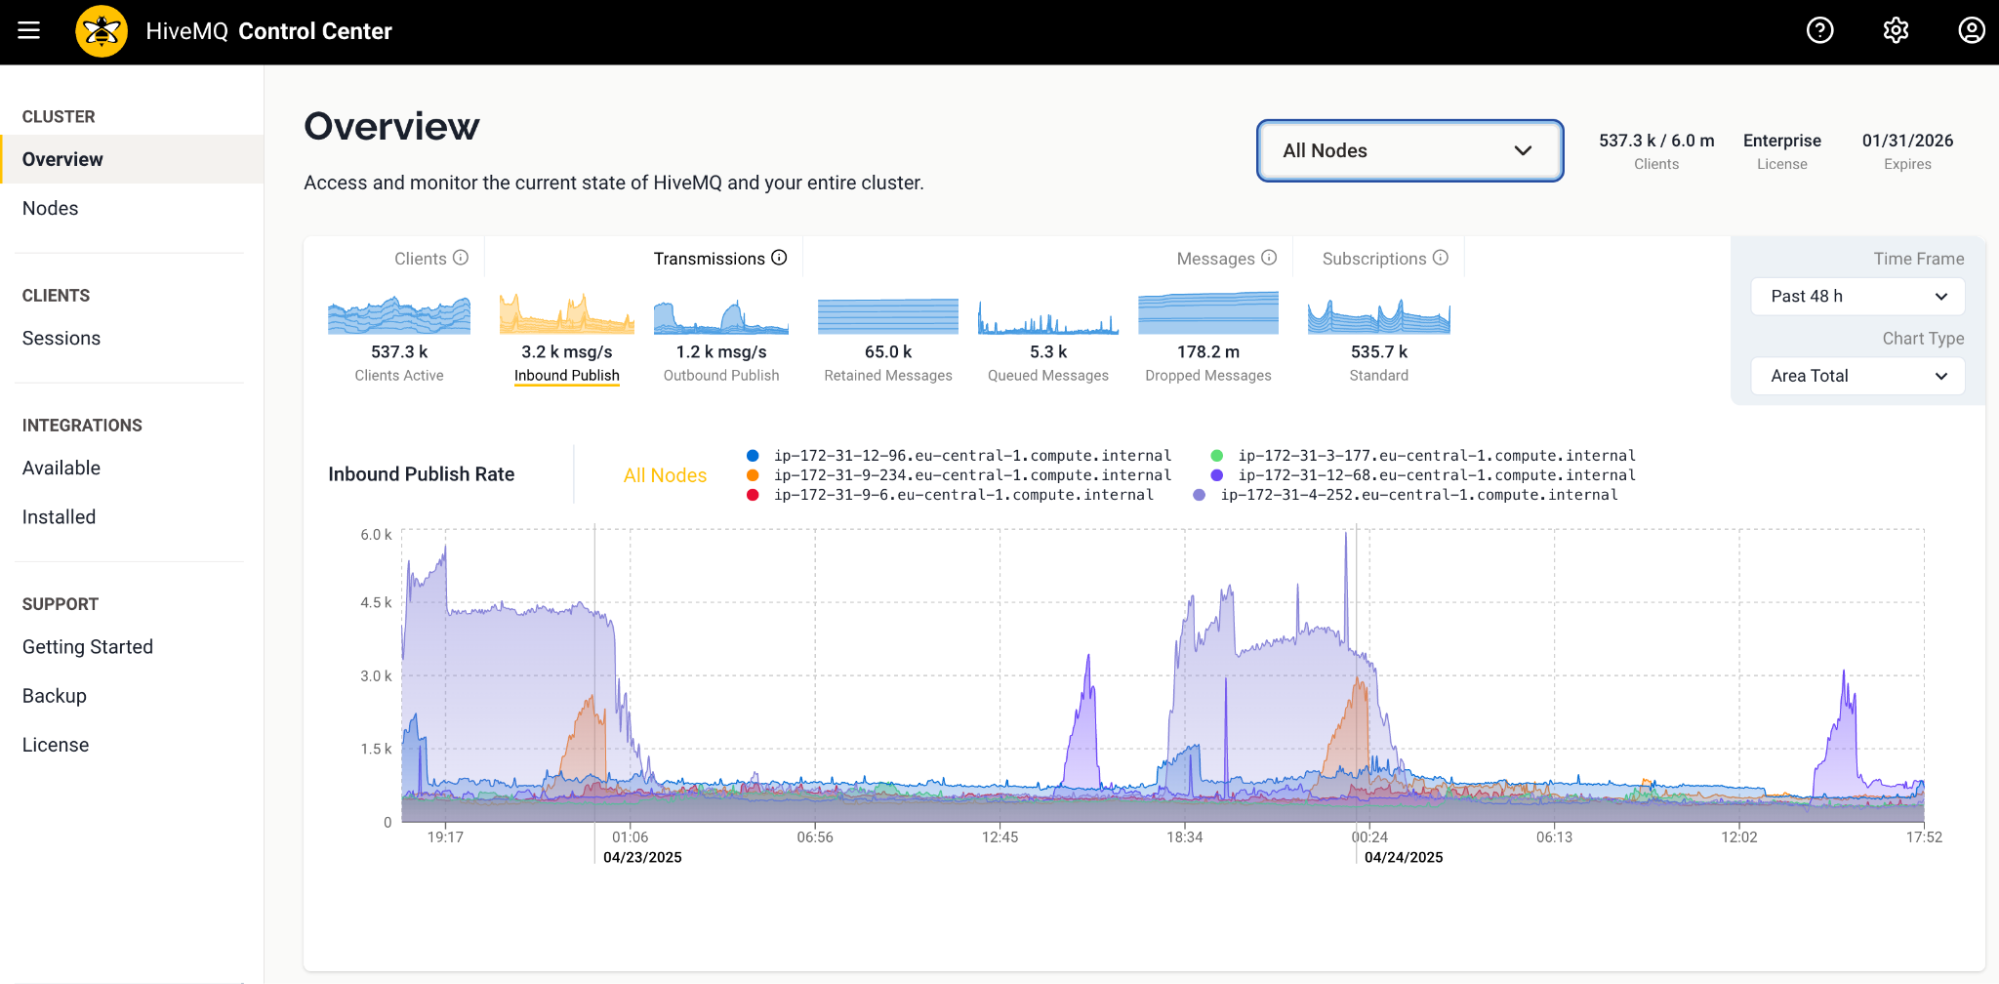
Overview Dashboard Metric Graphs
The thumbnail graphs across the top of the Overview dashboard give you a quick snapshot of key metrics such as the current usage and cluster throughput.
| The data on the Overview dashboard does not update automatically. To load the latest data, refresh your browser window. |
| Graph Title | Description |
|---|---|
Active Clients |
The total number of client connections currently in use. |
Inbound Publish |
The current rate of inbound publish messages per second. |
Outbound Publish |
The current rate of outbound publish messages per second. |
Retained Messages |
The total number of retained messages. |
Queued Messages |
The total number of queued messages. |
Dropped Messages |
The total number of dropped messages. |
Subscriptions |
The total number of standard and shared subscriptions. |
Overview Dashboard Metric Detail Charts
To dive deeper into a specific metric, select the graph in the overview bar to load detailed information in the main area of the page.
The following detailed metric charts are available.
By default, the chart loads data for all nodes in the cluster. To limit the data to a specific node, select the identifier of the desired node on the overview or from the drop-down menu at the top of the overview.
| Chart Name | Description |
|---|---|
Clients |
The total number of client connections in use over the selected time frame for all nodes or per node. |
Inbound Publish Messages |
The total number of inbound publish messages sent over the selected time frame for all nodes or per node. |
Outbound Publish Messages |
The total number of outbound publish messages sent over the selected time frame for all nodes or per node. |
Retained Messages |
The total number of retained messages over the selected time frame for all nodes or per node. |
Queued Messages |
The total number of messages stored in message queues over the selected time frame for all nodes or per node. |
Dropped Messages |
The total number of dropped messages over the selected time frame for all nodes or per node. |
Subscriptions |
The total number of standard and shared subscriptions over the selected time frame for all nodes or per node. |
To further customize the data on your dashboard, you can set a time frame and select a chart type.
The Time Frame field sets the period in hours for which data is displayed. The default time frame is Past 1 h. Available time frames are Past 1 h, Past 4 h, Past 12 h, Past 24 h, Past 48 h, and Past 72 h.
The Chart Type field sets how your data is visualized on the overview. The default chart type is Area Total. Available chart types are Area Total, Area Stacked, % Stacked, and Line Total.
|
Metrics for the dashboard are displayed since the current start of each broker node.
Metrics prior to the most recent start of the node are not available. Even when the display timeframe is set to the past 72 hours, the dashboard can only report metrics since the start of a node. |
Queued Messages Chart
The Queued Messages chart of the Overview dashboard displays the volume and distribution of queued messages across your HiveMQ Platform cluster over time.
By default, the Queued Messages chart loads data for all nodes in the cluster.
To limit the data to a specific node, select the identifier of the desired node at the top of the chart or from the drop-down menu at the top of the overview.
| The Queued Messages chart and the Queued Messages Distribution does not include MQTT client QoS 0 queued messages. |
Queued Messages Distribution
The Queued Messages Distribution section provides a summary of current queues across your cluster:
| Entry | Description |
|---|---|
Context |
The type of message queues the data represents. Possible contexts are Clients and Shared Subscriptions / Extensions. |
Messages |
The current number of queued messages in the shared subscriptions / extensions or clients context. |
Ratio |
The ratio of queued messages per context to the total number of queued messages on your HiveMQ cluster. |
Distribution |
A visual representation of the distribution of queued messages per context on your HiveMQ cluster. |
Total |
The total number of queued messages on your HiveMQ cluster. |
It is also possible to monitor detailed queued message information within a specific context.
Select View Details to access fine-grained information for each of the following contexts:
Queued Messages Clients Context
The Clients context for queued messages lists clients that currently have queued messages. Clients are shown in descending order with the largest queue first. The queue size includes queued messages of all QoS levels.
| Entry | Description |
|---|---|
Client ID |
The ID of the client for which the messages are queued. |
Connection |
The current connection status of the client. Possible values are Active (connected) or Inactive (disconnected). |
Queue Size |
The total number of messages in the message queue of the client. The Queue Size includes all QoS message levels. |
Last Status Change |
The timestamp of the last time the client changed its connection status between connected and disconnected. |
Queued Messages Client Search
The Client ID search field allows you to quickly filter for clients that start with the entered string. To create a search, enter one or more characters and select Search.
| For more sophisticated queries across the available client session data with customizable filters and conditions, use our Advanced Client Search. |
Queued Messages Client Detail
When you select a specific entry on the Clients list, the client session information details for the selected client open.
For more information, see Client Details.
Queued Messages Shared Subscriptions Context
The Shared Subscriptions context for queued messages lists all shared subscription groups that currently have QoS1 queued messages.
| Shared Name | The name of the shared subscription group. |
|---|---|
Topic Filter |
The topic filter of the shared subscription. |
Queue Size |
The number of QoS 1 messages that are currently in the queue of the shared subscription. |
Queued Messages Shared Subscriptions Topic Filter Search
The Topic Filter search field allows you to quickly filter for topic filters that start with the entered string. To create a search, enter one or more characters and select Search.
Queued Messages Shared Subscriptions Detail
When you select a specific Shared Name on the Shared Subscriptions list, further details for the selected shared subscription display. The details include a list of clients that are part of the shared subscription.
| Entry | Description |
|---|---|
Shared Name |
The name of the shared subscription group. |
Topic Filter |
The topic filter of the shared subscription (can include wildcards). |
QoS 1 Message Queue Size |
The number of QoS 1 messages that are currently in the queue of the shared subscription. |
Maximum Message Queue Size |
The maximum number of messages the shared subscription can store in its message queue. |
Drop Strategy for Queued Messages |
Defines how the broker manages messages when the limit for the message queue is reached:
|
Clients |
Shows the client ID, QoS level, and connection state of each client in the shared subscription group. |
Queued Messages Extension Consumers Context
The Extension Consumers context for queued messages lists all registered extension consumers that have queued messages. Installed extensions can contain one or more consumers. Each configured mapping of an extension is an individual consumer.
| Extension Name | The name of the extension for which the selected consumer is registered. |
|---|---|
Consumer ID |
The unique ID of the extension consumer. |
Topic Filter |
The topic filter from which the selected extension consumer receives messages. |
Queue Size |
The current number of QoS 1 messages in the message queue of the extension consumer. |
Maximum Queue Size |
The queue size limit that is set for the extension consumer per topic filter.
The default value is |
| The queued messages data does not update automatically. To view the most recent state for a context, select Refresh. |
Dropped Messages Chart
The Dropped Messages chart of the Overview dashboard provides additional fine-grained information that enables you to analyze all dropped messages on your HiveMQ Platform cluster.
The following information for dropped messages displays directly below the Dropped Messages chart:
-
The reasons messages dropped. For more information, see Reasons for Dropped Messages
-
The clients for which messages dropped. For more information, see Dropped Messages per Client.
-
The shared subscription groups for which messages dropped. For more information, see Dropped Messages per Shared Subscription Group.
-
The extension consumers for which messages dropped. For more information, see Dropped Messages per Extension Consumer.
Reasons for Dropped Messages
A dropped message is a message that the broker does not publish to the intended recipient for a variety of reasons. Dropped messages never leave the broker.
Your HiveMQ broker can drop a message for the following reasons:
| Reason | Description |
|---|---|
Indicates that the message queue of the client was full when another message for the client arrived. |
|
Indicates that the message queue of the shared subscription was full when another message for the shared subscription arrived. |
|
Indicates that the message queue of the extension consumer was full when another message for the extension consumer arrived. |
|
The broker-wide memory limit for queueing Quality of Service 0 messages has been exceeded. |
|
Quality of Service 0 message could not be delivered because it was impossible to write to the client socket. |
|
The message size was bigger than the maximum size of the receiving client. |
|
Message delivery was prevented by a publish inbound interceptor or publish outbound interceptor. |
|
Message delivery was prevented by a Data Hub policy. |
|
Messages dropped due to internal errors. |
The Reasons for dropped messages area displays dropped messages data for the last 4 days.
| Column | Description |
|---|---|
Reasons |
The reason the messages were dropped. For more information, see Possible reasons for dropped messages. |
Messages |
The total number of messages dropped for a particular reason. For more information, see Detailed Explanation of Dropped Message Reasons. |
Ratio |
The percentage of dropped messages for the dropped message reason. |
Distribution |
A visual representation of ratio. |
The History Summary chart visualizes your dropped messages data of the last 72 hours in a stacked percentage chart.
Dropped Messages Details
To view dropped messages information per client, shared subscription group, or extension consumer, select View details.
The tabs of the Dropped Messages Details view display information for analyzing dropped messages across different contexts:
-
Clients: The Clients tab provides detailed dropped messages information per MQTT client.
-
Shared Subscriptions: The Shared Subscriptions tab provides detailed dropped messages information per shared subscription group.
-
Extension Consumers: The Extension Consumer tab provides detailed dropped messages information per extension consumer.
| Use the search options on each tab to quickly locate dropped message data for a specific client, shared subscription, or extension consumer. |
Dropped Messages per Client
The Clients tab of the Dropped Messages details provides dropped message information per client. The following information is available for each client that has dropped messages on your HiveMQ Platform over the last four days:
| Column | Description |
|---|---|
Client ID |
The ID of the client that dropped messages. To view session information of the client, select the client ID. |
First Dropped Message |
The timestamp when the client dropped the first message. |
Last Dropped Message |
The timestamp when the client dropped the last message. |
Indicates that the message queue of the client was already full when the new message for the client arrived. |
|
Indicates that the broker-wide memory for queueing Quality of Service level 0 (QoS 0) messages has been exceeded. |
|
Indicates that the QoS 0 message could not be delivered because it was impossible to write to the client socket. |
|
Indicates that the size of the incoming message exceeded the maximum message size the client allows. |
|
Indicates that a publish inbound interceptor or publish outbound interceptor of an extension prevented delivery of the message. |
|
Indicates that a Data Hub policy prevented delivery of the message. |
|
Indicates that an internal error in the broker prevented message delivery. |
Dropped Messages per Shared Subscription Group
The Shared Subscriptions tab of the Dropped Messages details provides dropped message information per shared subscription group. The following information is available for each shared subscription group that has dropped messages on your HiveMQ Platform over the last four days:
| Column | Description |
|---|---|
Topic Name |
The specific topic subscription of the shared subscription (can include wildcards). |
First Dropped Message |
The timestamp of the first message the group dropped. |
Last Dropped Message |
The timestamp of the last message the group dropped. |
Indicates that the message queue of the shared subscription was already full when the new message for the shared subscription arrived. |
|
Indicates that the broker-wide memory for queueing Quality of Service level 0 (QoS 0) messages has been exceeded. |
|
Indicates that an internal error in the broker prevented message delivery. |
Dropped Messages per Extension Consumer
The Extension Consumers tab of the Dropped Messages details provides dropped message information per extension consumer. The following information is available for each extension consumer that has dropped messages on your HiveMQ Platform over the last four days:
| Column | Description |
|---|---|
Consumer ID |
The ID of the extension consumer. |
First Dropped Message |
The timestamp of the first message the extension consumer dropped. |
Last Dropped Message |
The timestamp of the last message the extension consumer dropped. |
Indicates that the message queue of the extension consumer was already full when the new message for the extension consumer arrived. |
|
Indicates that the broker-wide memory for queueing Quality of Service level 0 (QoS 0) messages has been exceeded. |
|
Indicates that an internal error in the broker prevented message delivery. |
Detailed Explanation of Dropped Message Reasons
For most use cases, message delivery must be as reliable as possible and the dropping of messages is not a desired outcome.
However, this does not mean that every dropped message represents a problem that requires your immediate attention.
The HiveMQ Control Center offers an in-depth look into why messages are dropped and for which clients.
The following information outlines some possible causes of dropped messages and offers insights for debugging purposes.
Client Message Queue Full
The client message queue full reason indicates that the internal message queue of the client for incoming messages that are not yet processed has reached its maximum capacity.
Message queueing can occur when a client with a persistent session is temporarily offline or when the broker sends messages faster than the client can consume the messages.
If your clients frequently experience this kind of dropped message, it can mean that your clients are not able to process received messages fast enough or that the network connection of the client is very unstable.
| You can configure how many messages your HiveMQ broker is allowed to queue per client and how received messages that exceed the maximum queue size are handled. For more information, see Queued Messages. |
Shared Subscription Message Queue Full
The shared subscription message queue full reason indicates that the internal message queue of the shared subscription for incoming messages that are not yet processed has reached its maximum capacity.
Message queueing can occur when the broker sends messages faster than the subscribed clients can consume the messages.
Extension Consumer Message Queue Full
The extension consumer message queue full reason indicates that the internal message queue of the extension consumer for incoming messages that are not yet processed has reached its maximum capacity.
Message queueing can occur when the broker sends messages faster than the extension can consume the messages.
QoS 0 Memory Exceeded
When the broker receives messages with Quality of Service 0 (QoS 0), the broker puts the message into a global in-memory queue to await delivery to the intended client.
If the size of the QoS 0 queue exceeds the configured memory limit of the broker, additional incoming QoS 0 messages are dropped.
If your clients frequently experience this kind of dropped message, it can indicate that your clients are consuming messages too slowly, that clients have unstable network connections, or that your broker is not configured with sufficient memory.
QoS 0 Channel Not Writable
When the broker receives a message with QoS 0 and the socket of the intended receiving client cannot be written to, the broker drops the message.
This drop reason can indicate that the client is unable to read messages fast enough to keep up with the incoming messages.
Maximum Packet Size Exceeded
MQTT 5 allows you to set the maximum message packet size that an MQTT client accepts.
If a message exceeds the allowed maximum packet size of the receiving client, the broker drops the message.
A high number of this kind of dropped messages can indicate suboptimal coordination between your sending and receiving clients.
Extension Prevented
The use of a publish inbound interceptor or publish outbound interceptor in an extension allows you to prevent the onward delivery of specific messages.
When a publish inbound or publish outbound interceptor blocks delivery, the broker drops the message.
A best practice for extension development is to log and/or forward the reason for the delivery prevention to the intended client.
Data Hub Policy Prevented
Data Hub data policies verify the payload of incoming MQTT messages, and behavior policies model the behavior of MQTT clients across their lifecycle.
Data policies and behavior policies can include action pipeline operations that drop messages.
When a data or behavior policy drops an inbound message, the broker reports the drop with this reason.
If your clients frequently experience this kind of dropped message, review the data and behavior policies that apply to the affected clients and topics.
Internal Error
If an internal broker error occurs during the handling of a message, the broker drops the message.
The reason for the internal error is not specified.
Messages that drop due to an internal error indicate an unexpected underlying problem.
If you observe internal errors, check your HiveMQ log file for the referenced error or contact us for additional assistance.