HiveMQ Control Center v2: Nodes View
The Nodes view of your HiveMQ Control Center provides information and key metrics for every node in your HiveMQ Platform cluster. Each node is identified by its hostname and its randomly generated cluster node ID. The Nodes view visualizes the CPU load, memory usage, and disk space utilization of each node and provides an overview of the overall resource allocation within the cluster.
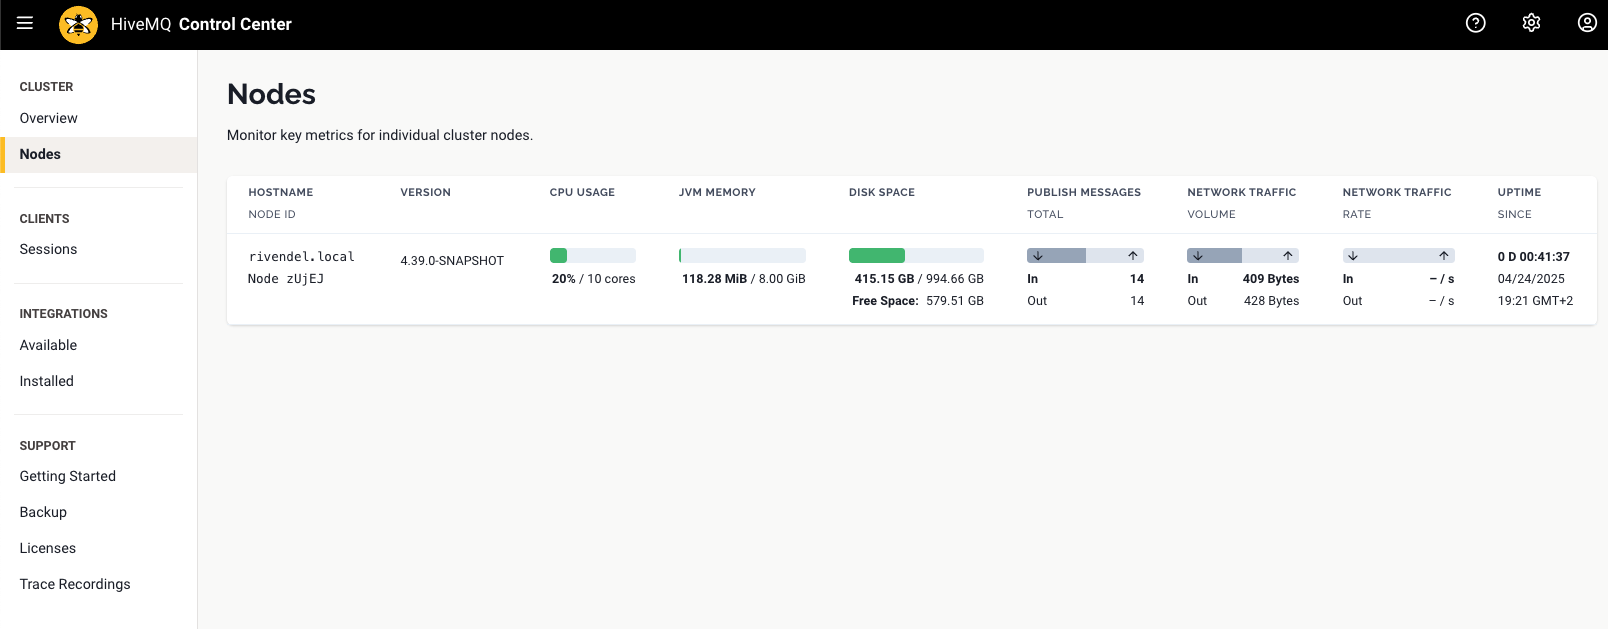
The following information and metrics are provided for each node:
| Column | Description |
|---|---|
Hostname/Node ID |
The hostname and the unique, randomly generated node ID of the HiveMQ Broker instance. |
HiveMQ Version |
The HiveMQ version the node runs. |
CPU Usage |
The percent CPU usage of the HiveMQ process and the number of CPU cores available. |
JVM Memory |
The amount of JVM memory in use and the total amount available. |
Disk Space |
The amount of disk space that HiveMQ uses and the total amount available. |
Total Publish Messages |
The total number of inbound and outbound publish messages. |
Network Traffic Volume |
The total volume of inbound and outbound network traffic. |
Network Traffic Rate |
The total inbound and outbound network traffic rates per second. |
Uptime |
The time when the selected node started. |
The CPU, Memory, and Disk Space indicators use color coding to represent the load levels of a node:
| Column | Description |
|---|---|
green < 75% |
Green indicates that the metric is within a healthy range. |
yellow > 75% < 90% |
Yellow indicates that the metric level is elevated. |
red > 90% |
Red indicates that the metric level is too high. |