Data Health
Data Health shows how well your live MQTT traffic matches the namespace definitions you created in Contextualize. Use the Data Health in Total metrics to confirm that consumers, such as dashboards and AI agents, receive correctly structured data. Check the Data Health per Broker panel to quickly identify on which brokers deviating traffic occurs.
| The Analyze view has two tabs: Data Health and Deviations. This page describes the Data Health tab. For the Deviations tab, see Review Deviations. |
| Set the optional timeframe selector to limit the metrics shown on the page to a specific period. For example, Last Week. |
How the HiveMQ Platform Categorizes Traffic
The platform splits your traffic into categories on two levels:
-
All traffic is either governed or ungoverned.
-
Governed traffic is further divided into healthy, deviating, and ignored traffic.
├── Governed Traffic
│   ├── Healthy Traffic
│   ├── Deviating Traffic
│   └── Ignored Traffic
└── Ungoverned Traffic
A high share of healthy traffic means that consumers can rely on the data.
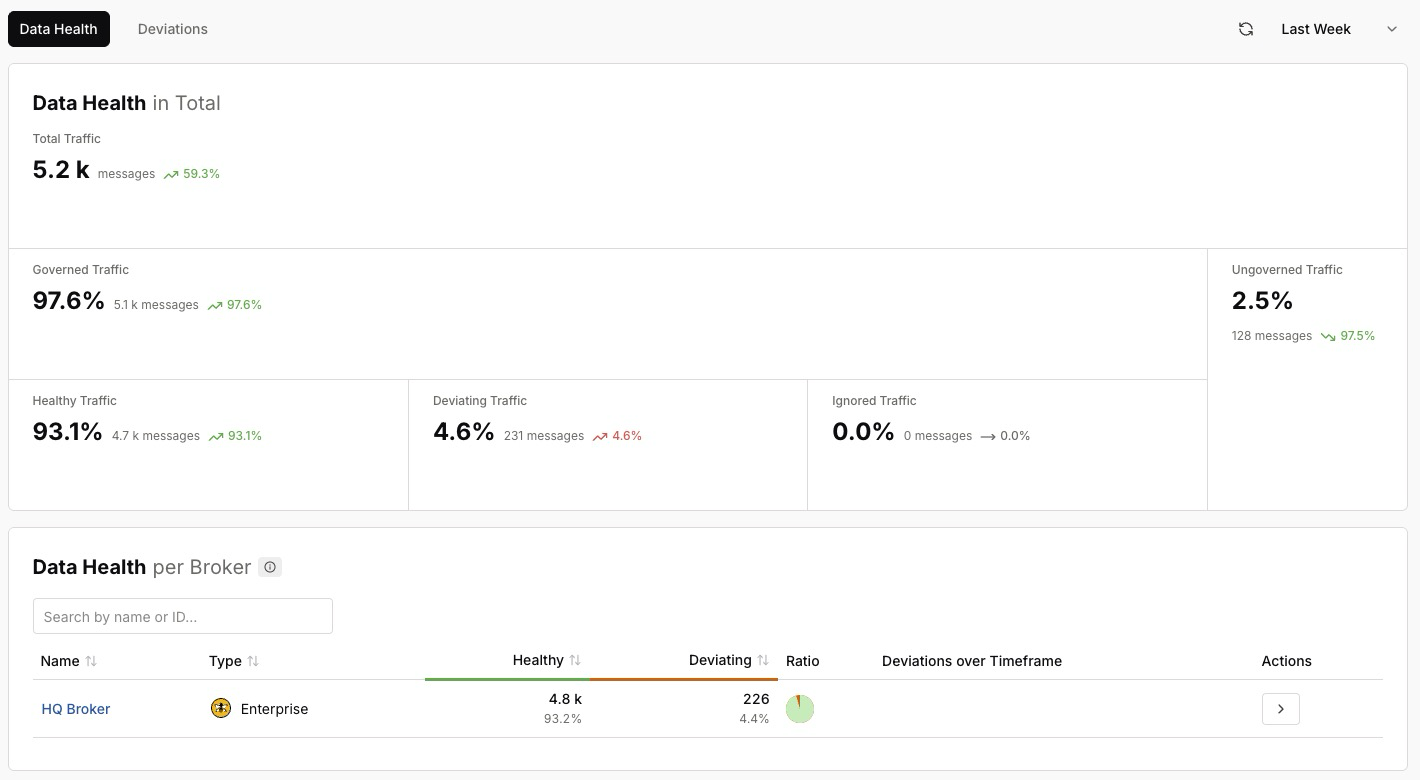
Data Health in Total
The Data Health in Total panel summarizes the quality of all traffic across your connected brokers for the selected timeframe. Each metric shows its share, the number of messages, and the trend over the timeframe.
| Metric | Description |
|---|---|
Total Traffic |
All messages observed across your connected brokers in the selected timeframe. |
Governed Traffic |
The share of traffic that is modeled and managed in your Unified Namespace. |
Ungoverned Traffic |
The share of traffic that is not part of the namespace. Use Discover Data Streams in Contextualize to bring ungoverned traffic under governance. |
Healthy Traffic |
Governed traffic that matches the expected data types and structure. |
Deviating Traffic |
Governed traffic that does not match the expected structure. To inspect each mismatch, see Review Deviations. |
Ignored Traffic |
Traffic on topics you have explicitly chosen to ignore. |
Data Health per Broker
The Data Health per Broker panel shows the same categories for each connected broker, so you can precisely locate where deviations originate.
To find a specific broker, enter its name or ID in the search field.
| Column | Description |
|---|---|
Name |
The name of the broker. For example, |
Type |
The broker type, such as Enterprise. |
Healthy |
The number and share of healthy traffic on the broker. |
Deviating |
The number and share of deviating traffic on the broker. |
Ratio |
The proportion of healthy to deviating traffic on the broker. |
Deviations over Timeframe |
The trend of deviations on the broker during the selected timeframe. |
Actions |
Open a detailed view of the data health of the broker. |