HiveMQ Control Center v2: Diagnostic Archive View
In the event that your HiveMQ cluster experiences problems that require immediate attention, quick access to all pertinent diagnostic information helps ensure the shortest possible MTTR (mean time to recovery). To simplify the information collection process, your HiveMQ Control Center provides a fully automated Diagnostic Archive function. The Diagnostic Archive feature makes it easy for control center administrators to collect all the information that a support engineer needs to identify root causes and propose solutions.
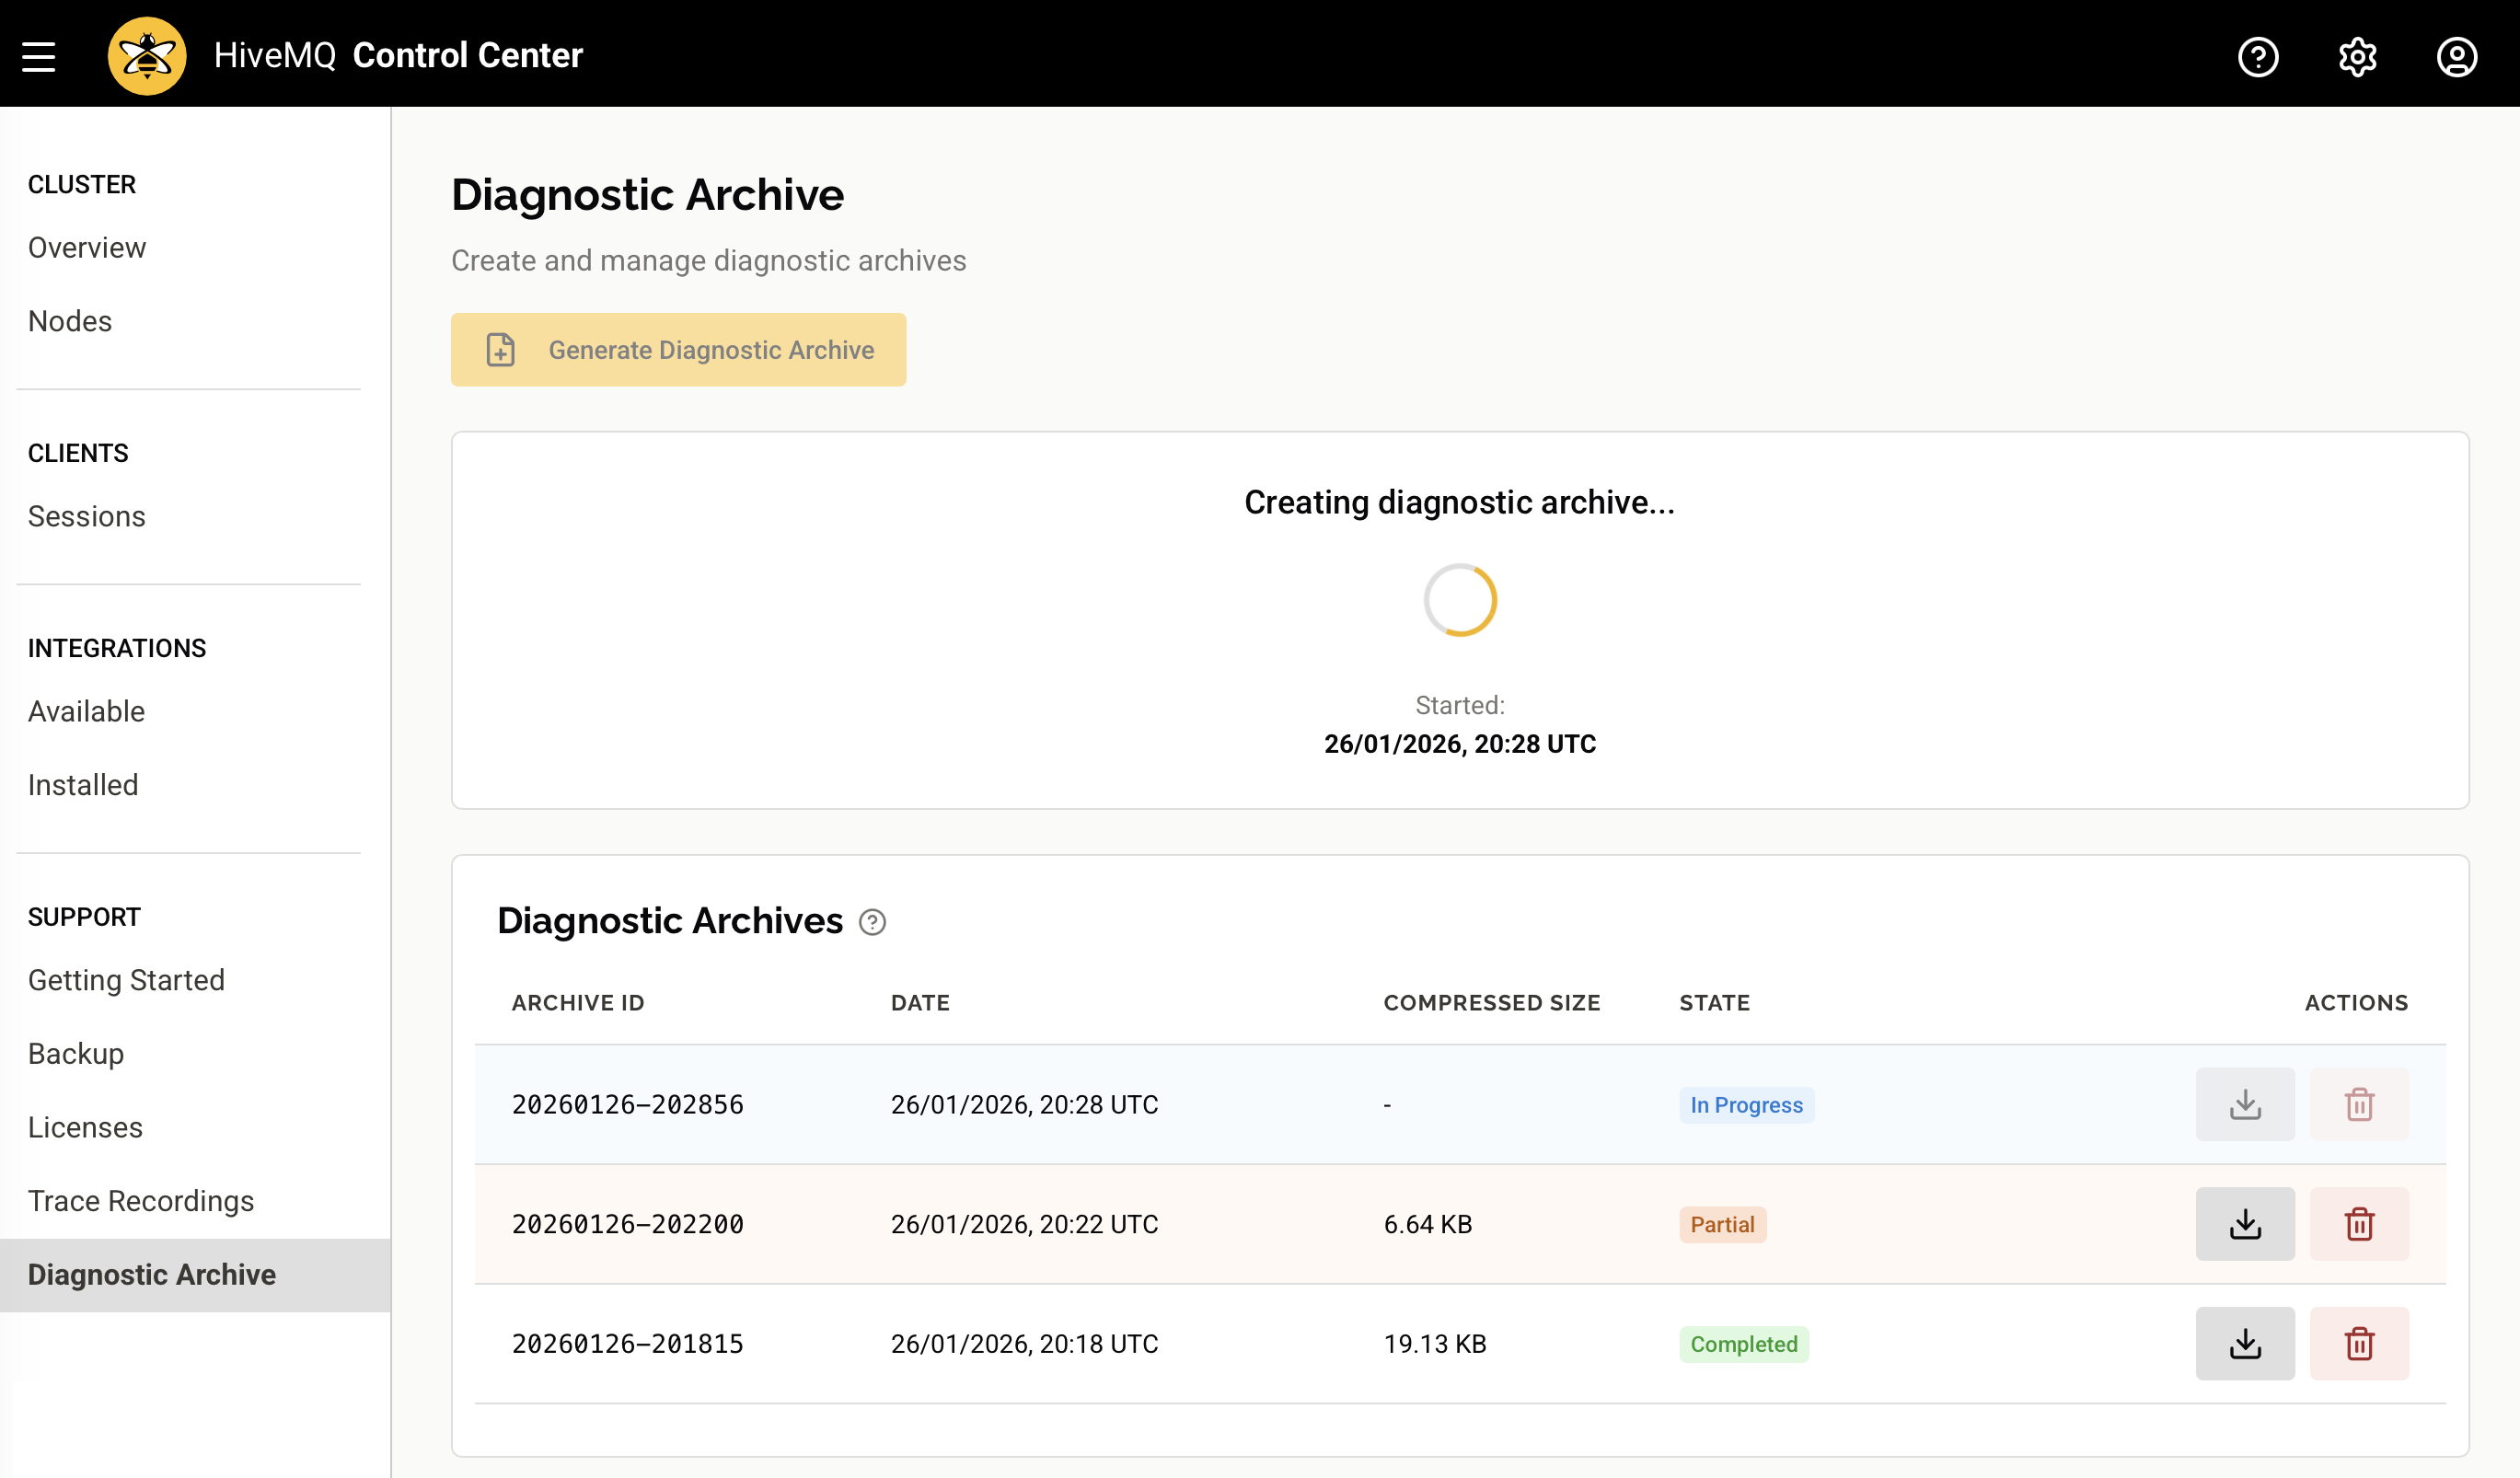
The Diagnostic Archive view of your HiveMQ Control Center provides a clear overview of all diagnostic archives in your cluster and a convenient way to create and download archive files:
Create Diagnostic Archive
To create a new diagnostic archive for your HiveMQ cluster, select Generate Archive on the Diagnostic Archive overview page.
A dialog opens where you can configure the archive creation options.
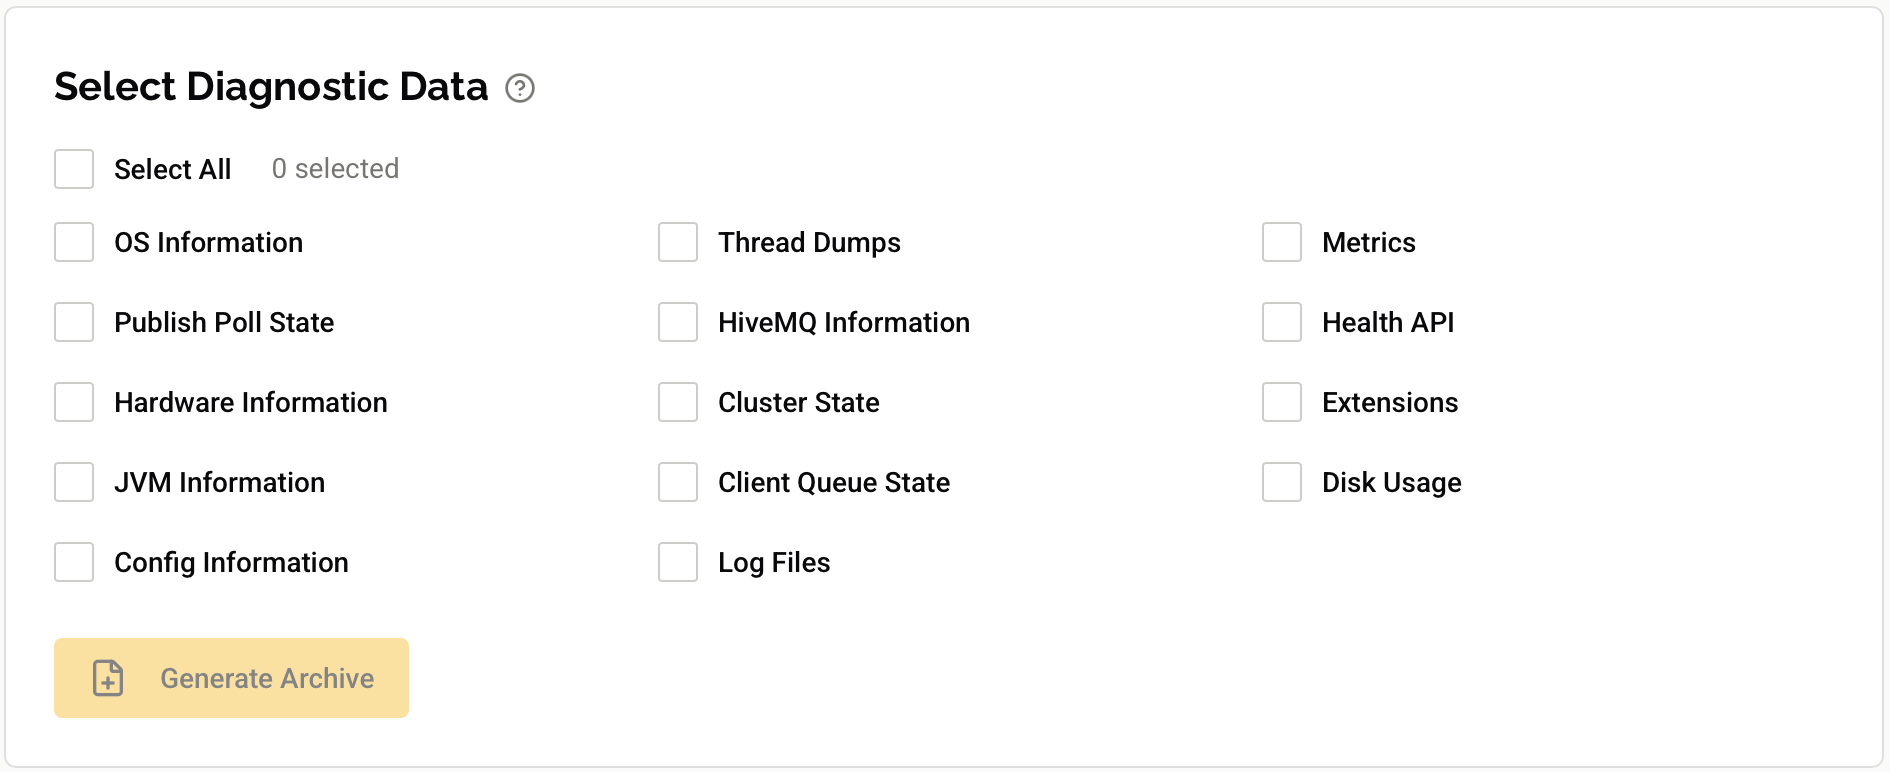
When you select Generate Archive, HiveMQ initiates the archive creation process on all nodes in your cluster simultaneously.
| You can only create one diagnostic archive at a time. |
| The archive creation process creates a combined diagnostic archive on the responsible node for REST API compatibility. When downloading from the HiveMQ Control Center V2, the combined archive is assembled on the fly from the individual node archives. |
Available Exporters
You can select which diagnostic information to include in your archive. Each exporter collects specific information from your HiveMQ cluster:
| Exporter | Information Collected |
|---|---|
OS Information |
Operating system details |
Hardware Information |
Hardware specifications and resources |
JVM Information |
Java Virtual Machine configuration and state |
HiveMQ Information |
HiveMQ version and license information |
Config Information |
HiveMQ |
Cluster State |
Cluster state and node information |
Extensions |
Information about installed HiveMQ extensions |
Health API |
Health API system health information |
Metrics |
HiveMQ metrics data |
Thread Dumps |
Java thread dump records |
Log Files |
Log files and rotated log files |
Disk Usage |
Disk usage information |
Client Queue State |
Client queue state information |
Publish Poll State |
Internal publish and poll state |
Additional Diagnostics |
Supplementary diagnostic information from selected HiveMQ components |
| Diagnostic archives automatically remove or anonymize sensitive information, such as credentials or passwords, from your configuration files. |
| In Kubernetes and cloud setups, only log files that exist on the filesystem are copied to the diagnostic archive. If logs are sent to an external system, such as CloudWatch or Elasticsearch, they are not included in the archive. |
Once archive creation is complete on all nodes, the archive appears in the Stored Diagnostic Archives overview with a Completed state. The comprehensive information the diagnostic archive collects from your cluster helps support engineers identify the root cause of problems and suggest appropriate action quickly.
Stored Diagnostic Archives
The Stored Diagnostic Archives overview lists all diagnostic archives that are currently stored in your cluster. The overview displays the archive ID, creation date, and the overall state of each archive.
Archive States
The status of the individual archives across all nodes in your cluster determines the combined state of each diagnostic archive:
| State | Description |
|---|---|
Completed |
All nodes in the cluster have successfully completed the archive creation. |
In Progress |
At least one node in the cluster is still creating the archive. |
Partial |
At least one node has a Not Found status. This typically occurs when a node joined the cluster after the archive was created, or when archive creation failed on some of the nodes. |
Download Archive
To download a combined diagnostic archive that contains data from all nodes in your cluster, select the Download action for the desired archive.
The combined ZIP file includes the individual archive from each node.
| If a node does not have an archive for the selected set (for example, when the archive state is Partial), the data from that node is not included in the download. This approach improves resiliency by allowing you to download available data even when some nodes are missing archives. |
Delete Archive
To delete a diagnostic archive and remove it from all nodes in your cluster, select the Delete action for the desired archive. A confirmation dialog appears. Once confirmed, the archive is removed from all nodes.
| The Delete action permanently deletes the archive from all nodes in the cluster. Deleted archives cannot be restored. |
Archive Details
To view detailed information about a specific diagnostic archive, select the archive from the list.
The Archive Details page opens and displays the creation status for each node in your cluster.
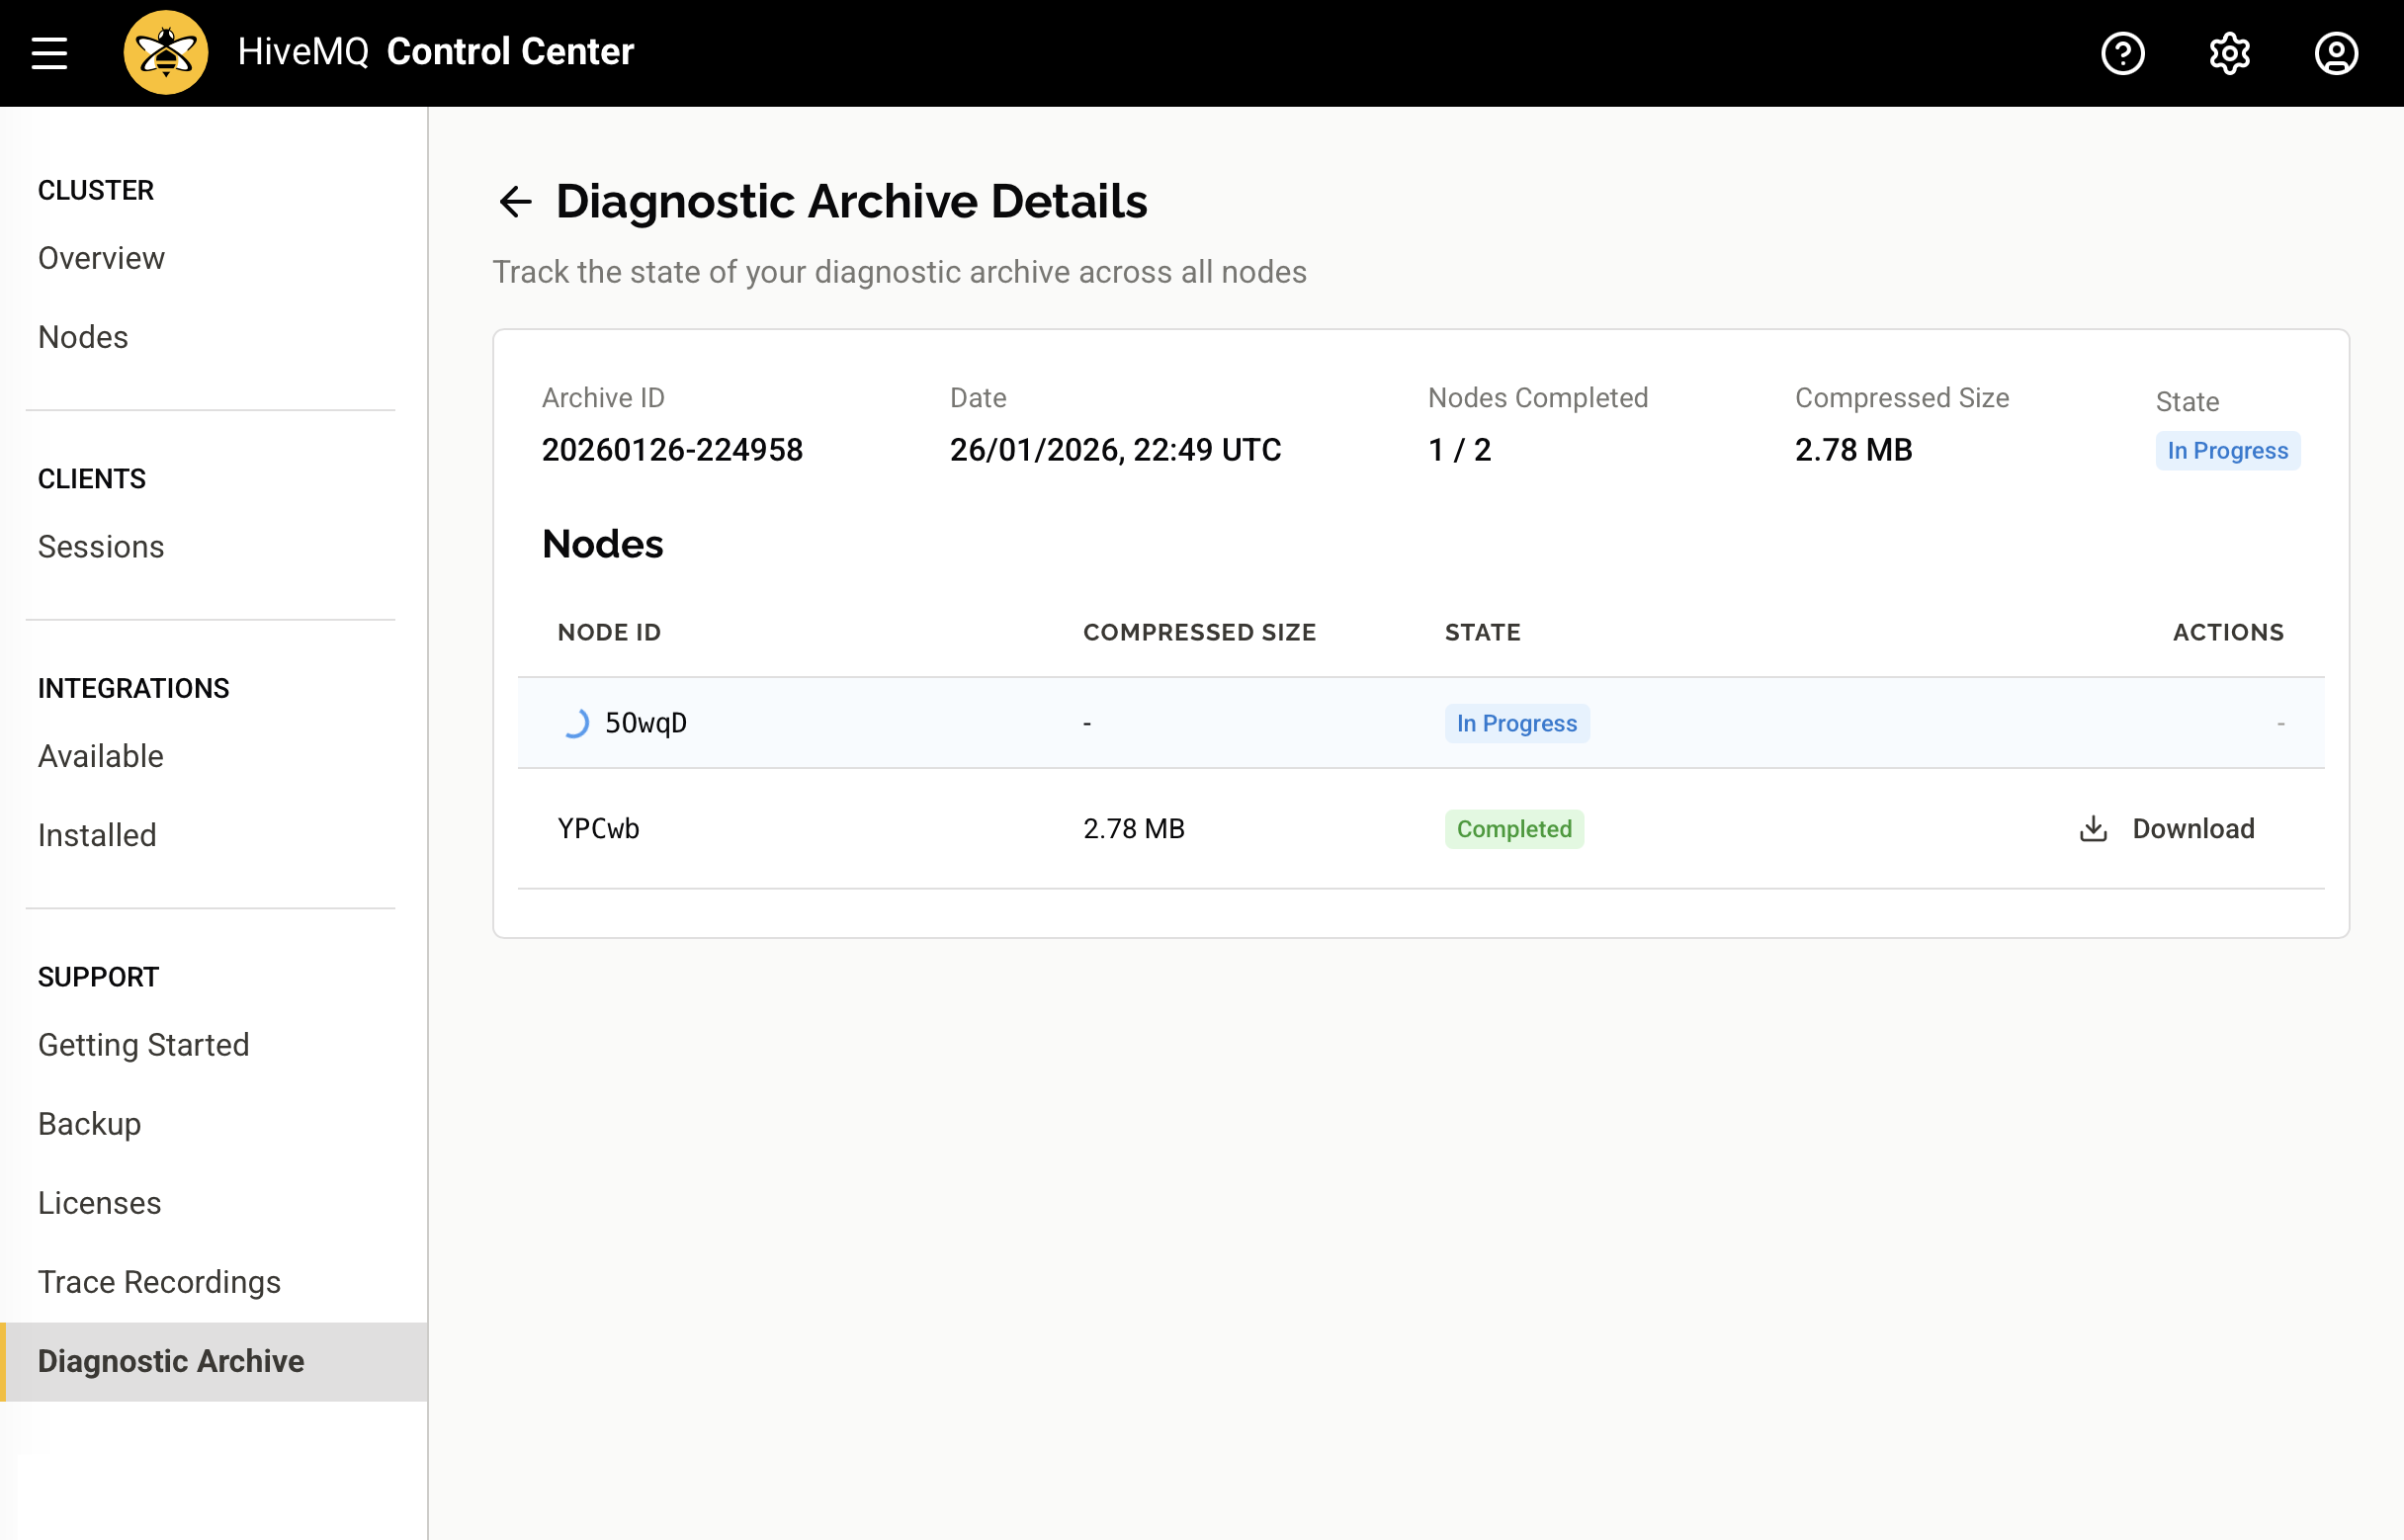
Node Status
The Archive Details page shows the status of the diagnostic archive for each node:
| Status | Description |
|---|---|
Completed |
The archive has been successfully created on this node and is ready for download. |
In Progress |
The archive is currently being created on this node. |
Not Found |
The archive does not exist on this node. This typically occurs when the node joined the cluster after the archive was created. |
Download Node Archive
You can download the diagnostic archive from a specific node without waiting for other nodes to complete.
To download a node-specific archive, select the Download action for the desired node once its status shows Completed.
| Downloading a node-specific archive is faster than downloading the combined archive and is useful when you are troubleshooting issues on a particular node. |
Partial Archive State
When some nodes in your cluster do not have a diagnostic archive, the archive state shows as Partial. This can happen when a node joins the cluster after an archive was created, or when the archive creation failed on some nodes.
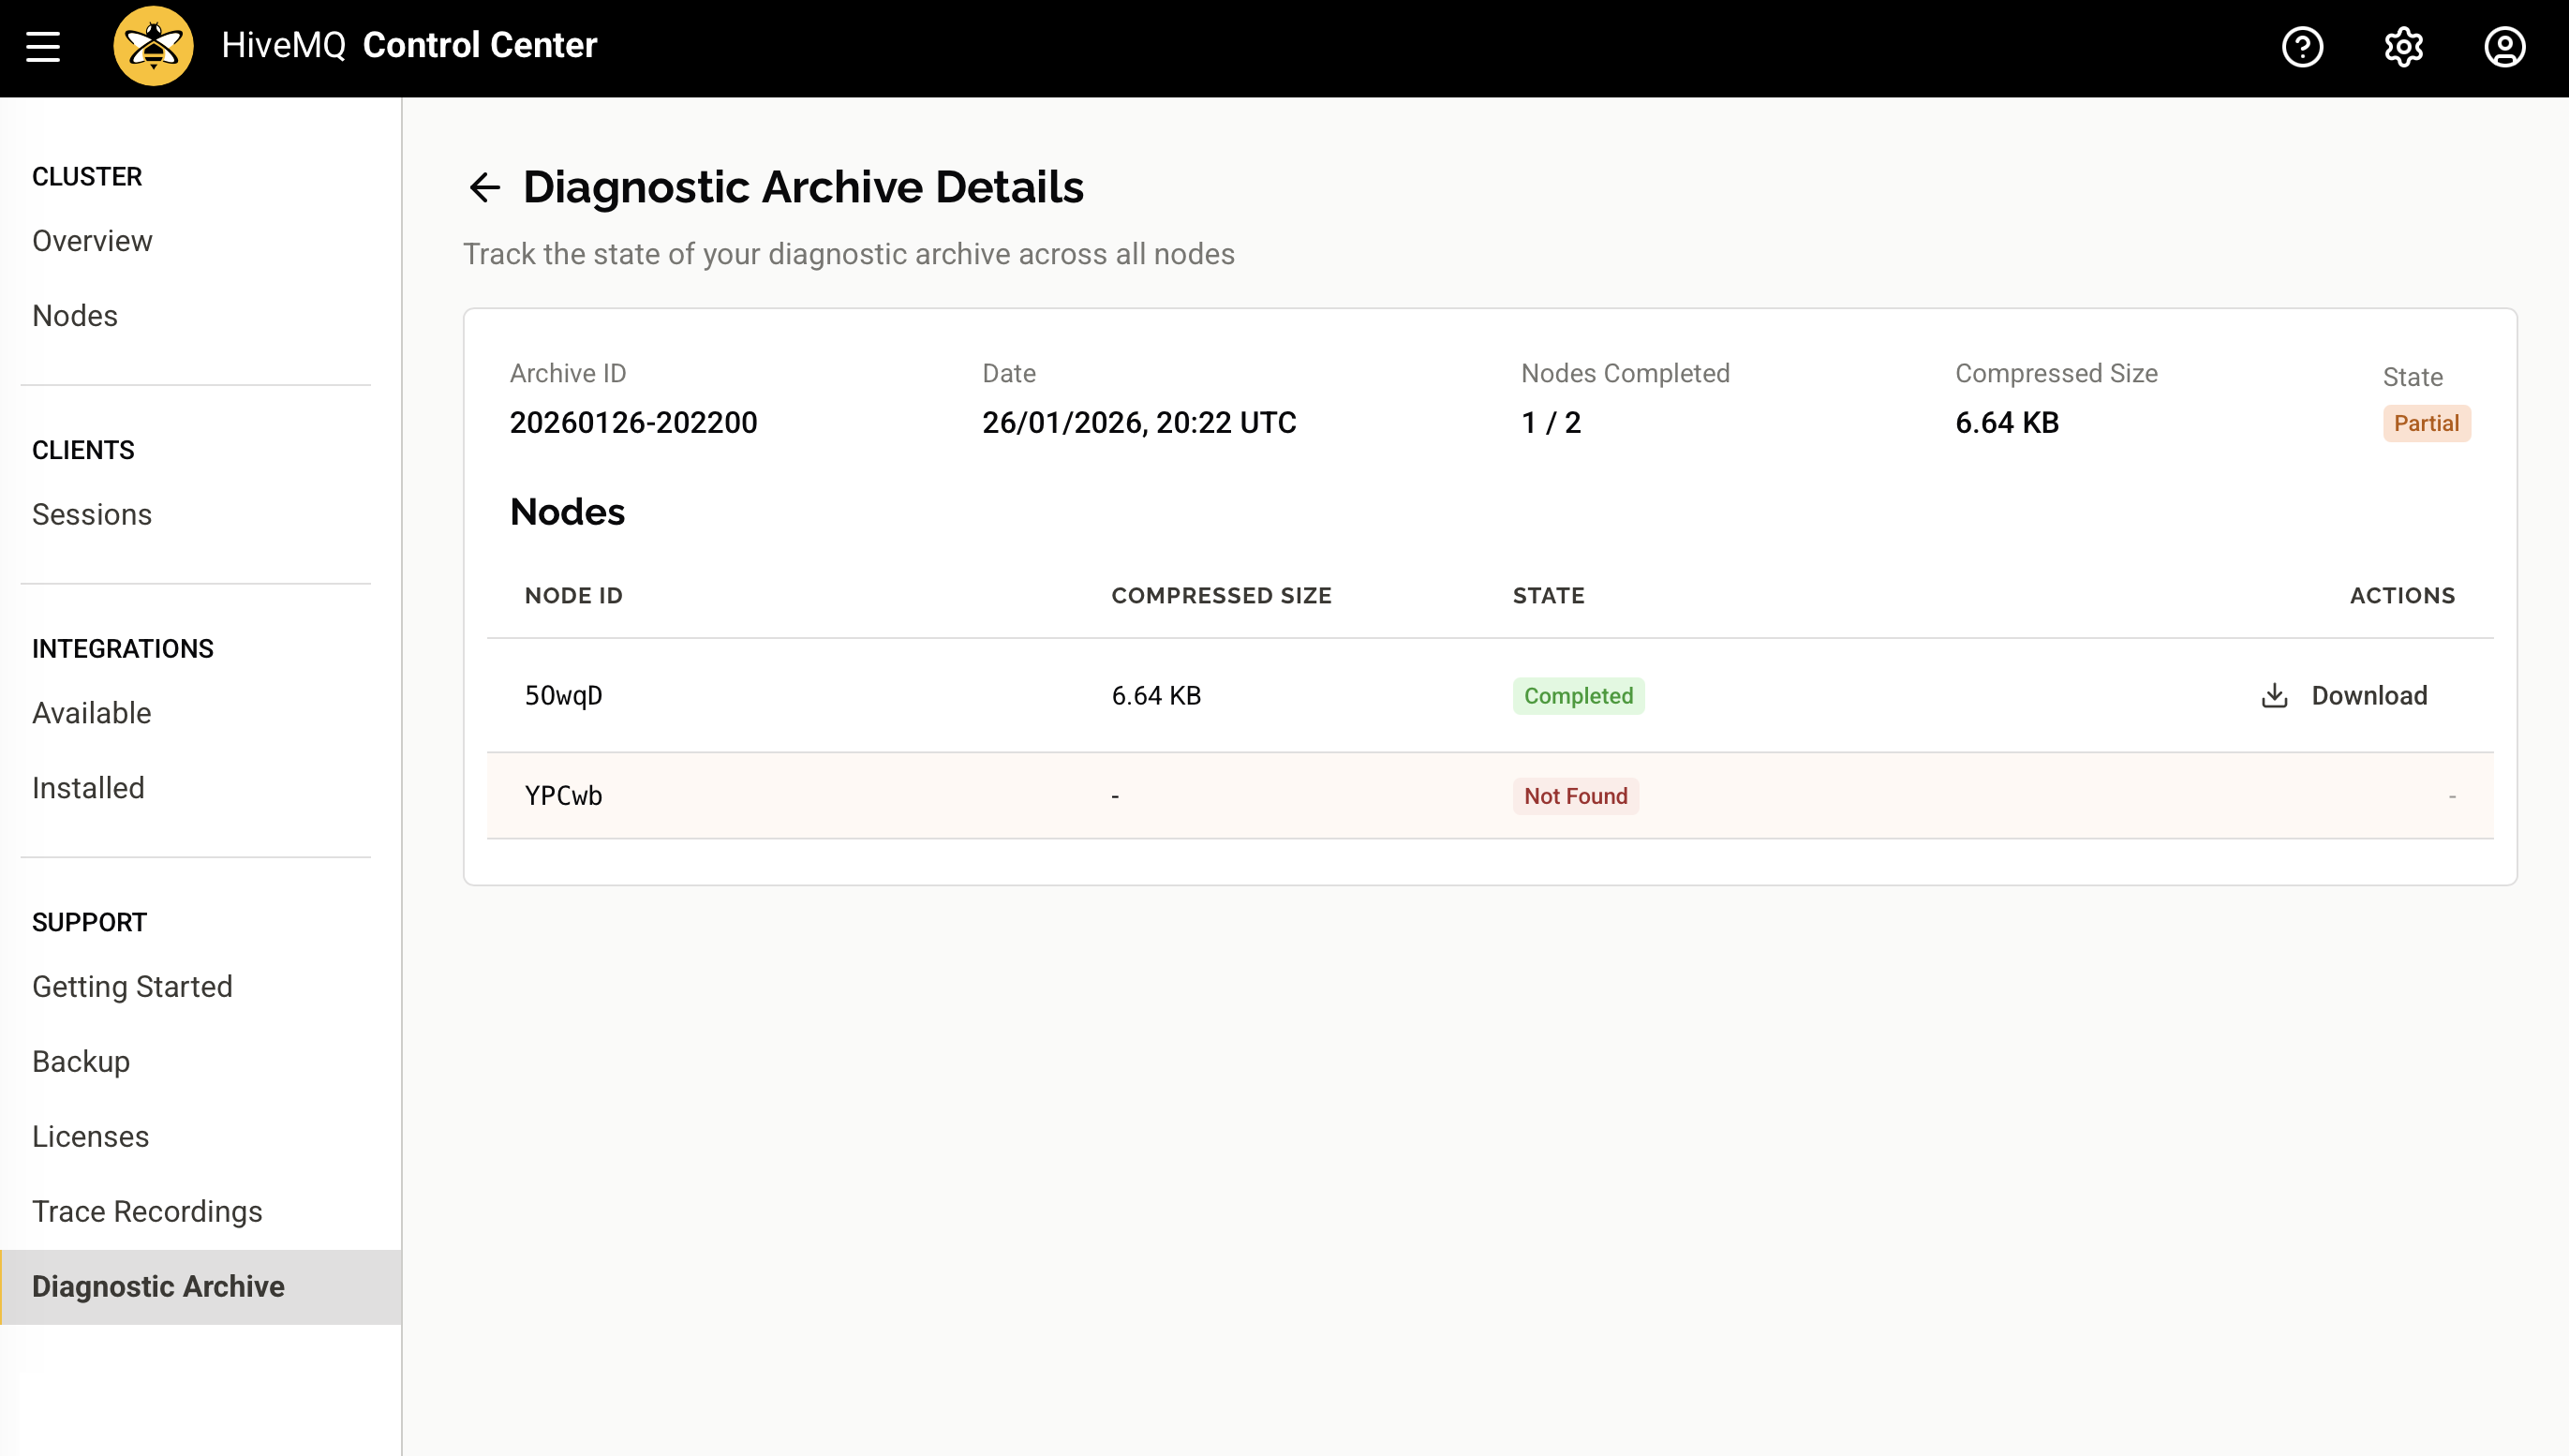
In this scenario, you can still download archives from the nodes that have completed successfully.