HiveMQ Edge Console
The HiveMQ Edge Console is a browser-based user interface for managing HiveMQ Edge. The Console provides a Human Machine Interface (HMI) for the Operational Technology (OT) gateway and broker capabilities of HiveMQ Edge.
Access the Console
To access the HiveMQ Edge Console, open a web browser and navigate to the Console URL.
If you are logged into the same host as the HiveMQ Edge instance, the default address is http://localhost:8080.
| If you cannot access the Console, verify the correct URL and port with the administrator who configured the instance. Your organization may have changed the defaults during deployment. |
Access the HiveMQ Edge Console with Docker
To run HiveMQ Edge with Docker and expose the Console, use the following command:
docker run --name hivemq-edge -d -p 1883:1883 -p 8080:8080 hivemq/hivemq-edgeThis command maps the MQTT port to 1883 and the Console access port to 8080.
Modify the port numbers as required for your environment.
Access the HiveMQ Edge Console with Kubernetes (k8s)
When you deploy HiveMQ Edge with Helm, the Console runs in read-only mode. Configuration changes through the API or Console are not supported in read-only mode.
To provide user access to the Console in a Kubernetes deployment, configure an internal ingress on the Edge pod. Depending on your network topology, routing Console access through a load balancer can be required.
Console Security
Login credentials for the HiveMQ Edge Console are managed through the Edge API and must be defined in the config.xml file.
    <admin-api>
        <users>
            <user>
                <username>admin</username>
                <password>hivemq</password>
                <roles>
                    <role>admin</role>
                </roles>
            </user>
        </users>
    </admin-api>
If left unconfigured, the default Console access credentials are username: admin password: hivemq.
| If your HiveMQ Edge Console is accessible on a public network, change the default credentials before deployment. |
HiveMQ Edge currently supports a single user with the default admin role.
Multiple users and role-based access control (RBAC) are not yet supported.
|
Console Pre Login Notice
The HiveMQ Edge Console supports a configurable pre-login notice that displays to users before they access the interface. Administrators can define a custom title, message, and an optional consent confirmation. When consent is required, users must explicitly accept the terms presented in the notice before they log in.
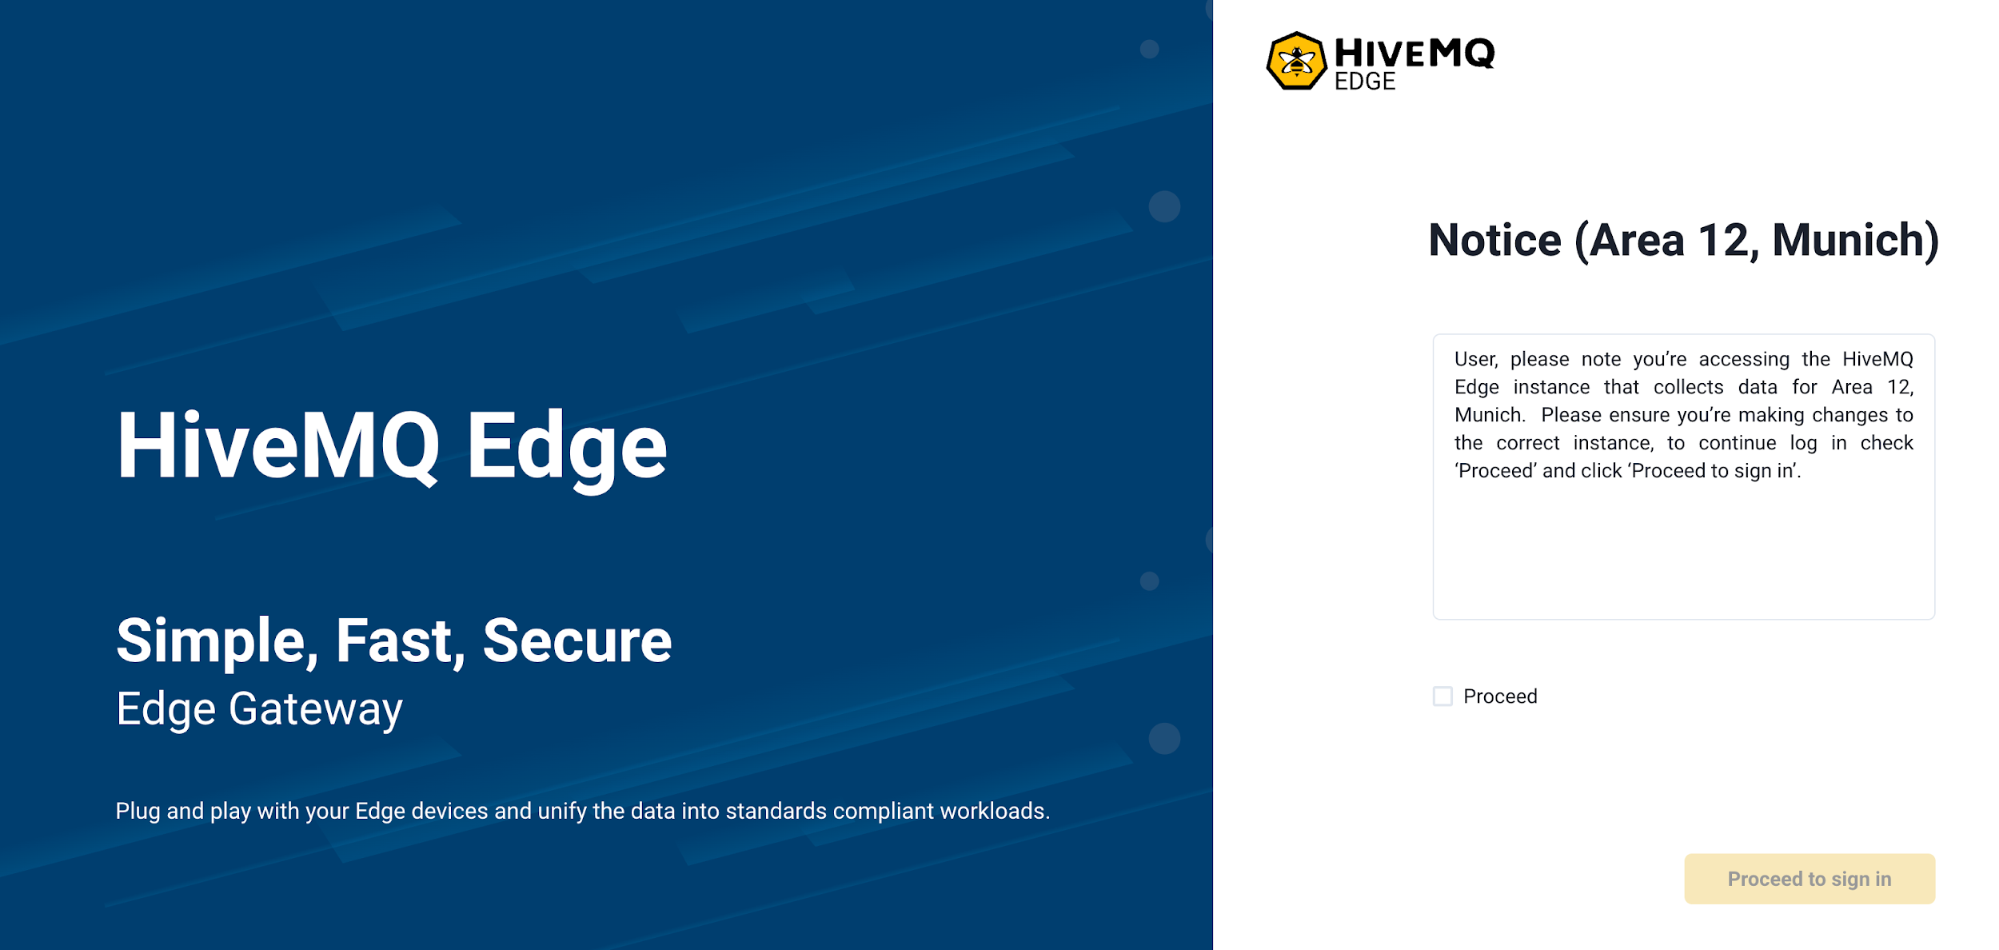
To configure an optional pre-login notice, use the pre-login-notice element in config.xml:
    <admin-api>
        <pre-login-notice>
           <enabled>true</enabled>
           <title>Notice (Area 12, Munich)</title>
           <message>You are about to access the HiveMQ Edge instance for Area 12, Munich. Ensure this is the correct instance before making any configuration changes. To continue, check 'Proceed' and click 'Proceed to sign in'.</message>
           <consent>Proceed</consent>
        </pre-login-notice>
    </admin-api>
Console Main Page
After a successful login, the HiveMQ Edge Console main page provides access to all monitoring, configuration, and management options.

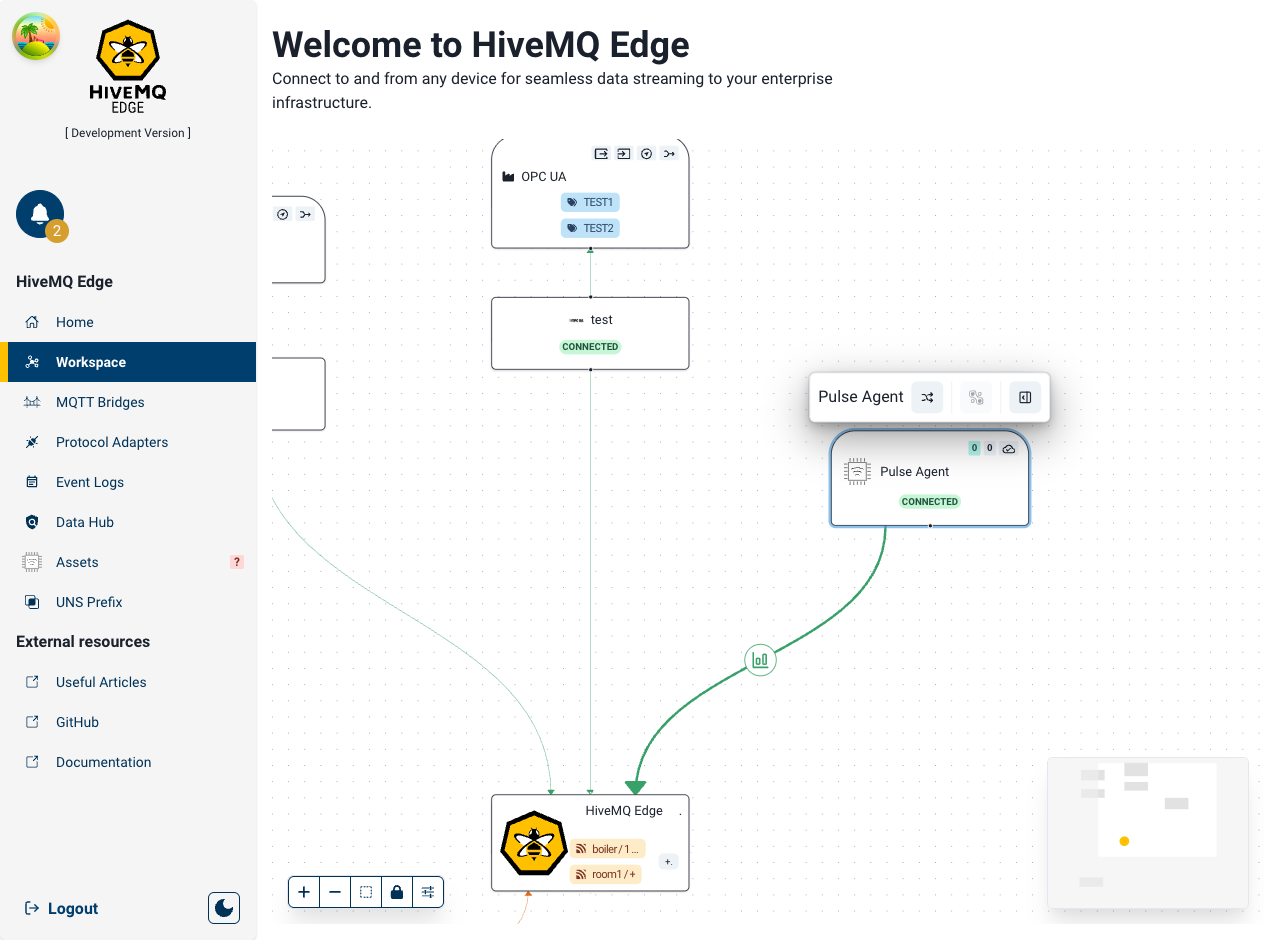
Console Main Menu
The navigation bar on the left side of the Console is the main menu to access configuration and monitoring options.
| Menu Item | Description |
|---|---|
Alerts (bell icon) |
Displays unread alerts about gateway events. A number badge indicates unread messages. |
Home |
A central view that provides guidance and support to create protocol adapters, bridge Edge to a HiveMQ Enterprise Broker or HiveMQ Cloud, and connect Edge to HiveMQ Pulse. |
Workspace |
A topological view of the gateway, broker, and connected OT devices for managing observability and configuration. |
MQTT Bridges |
Create and manage bridges to external brokers. Supports multiple bridges with MQTT topic filters to route messages to different destinations. |
Protocol Adapters |
List, create, and manage Protocol Adapters that connect to OT data sources and enable non-MQTT data ingestion into HiveMQ Edge. |
Event Logs |
Filterable and searchable list view of key events that occur in the HiveMQ Edge gateway. |
Data Hub |
Access the Data Hub designer, a workflow based rule engine to build and script policies to build and script data operations close to the data source. |
Assets |
View and manage HiveMQ Pulse-derived assets. Only accessible when the Edge instance is Pulse-activated. |
UNS Prefix |
Configure a UNS MQTT topic prefix prepended to all messages leaving HiveMQ Edge. |
External Resources |
Links to information hosted outside the Edge Console. |
Logout |
Exits the application and returns to the login screen. |
Dark Mode (moon icon) |
Toggles the interface between light mode to dark mode. |
Home Page
The home page of the HiveMQ Edge Console provides quick access to common setup tasks to get data flowing from devices into HiveMQ Edge and routing it to a HiveMQ Enterprise or Cloud broker.
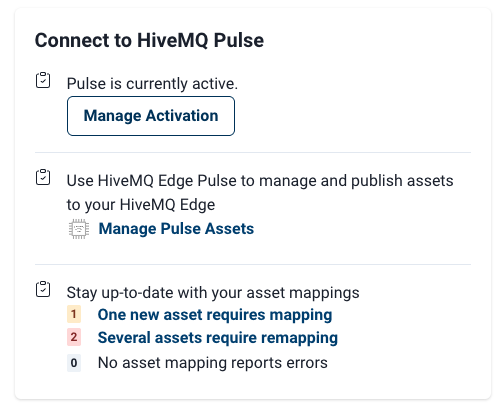
HiveMQ Pulse Provisioning
The home page also provides a Pulse Provisioning menu to initiate a HiveMQ Edge instance with HiveMQ Pulse.
To provision your HiveMQ Edge instance for connection to a Pulse Server instance, you must first obtain your Pulse Activation Token from the HiveMQ Pulse UI.
Navigate to the home screen of the Console for the HiveMQ Edge instance you want to provision. Log in if you have not already done so.

On the Console home screen, select Activate Pulse to open the Pulse Activation side pane.

In the provided input box, paste the Pulse Activation Token you copied from the HiveMQ Pulse Infrastructure view, and click Activate.
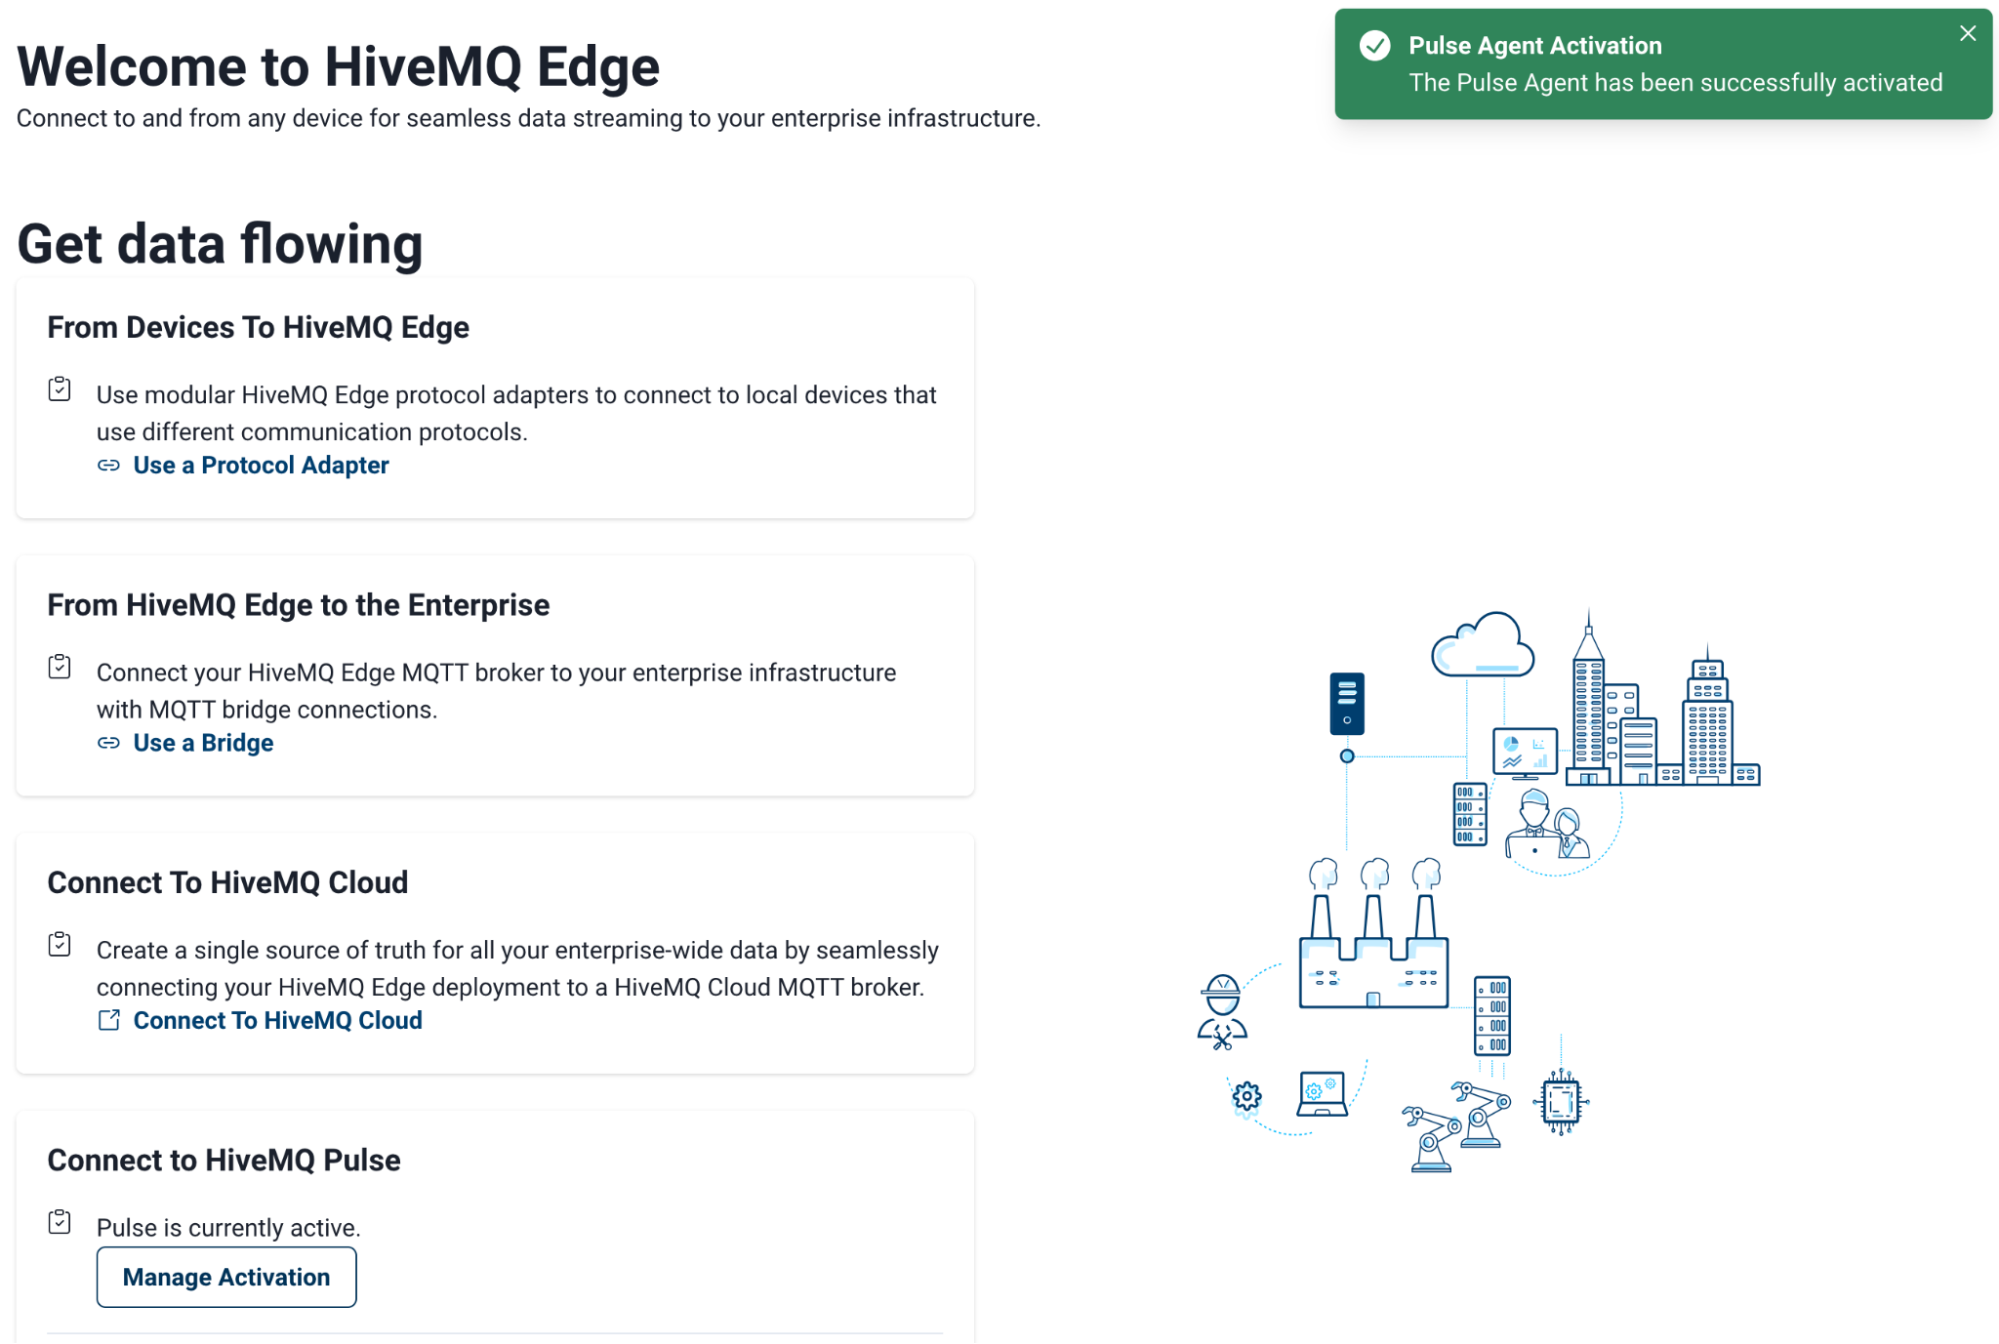
If the activation token is valid, HiveMQ Edge returns to the home screen and displays a green confirmation notification.
HiveMQ Edge is now provisioned with HiveMQ Pulse, and the Pulse panel updates to show the following information:
-
A Manage Activation option
-
A link to the Asset Manager
-
Shortcuts to unmapped assets
Console Workspace
The HiveMQ Edge Workspace is an observability and management interface that provides a topological view of your running HiveMQ Edge instance. To open the Workspace, select Workspace from the main navigation of the HiveMQ Edge Console.
Workspace Main View
When you open the HiveMQ Edge Workspace, a canvas displays with a map of all entities currently configured in your running HiveMQ Edge instance. Each entity is represented as a node on the canvas:
-
The node with the HiveMQ Edge logo at the center of the canvas represents the Edge Broker.
-
The toolbar in the bottom-left corner provides canvas controls.
-
The minimap in the bottom-right corner aids navigation when many nodes are present.

The Workspace canvas is cached locally in the browser.
Changes made outside the browser (for example, editing config.xml files directly) can cause the Workspace to display outdated information.
To manually refresh the view, open the HiveMQ Edge Workspace Configuration Panel.
|
Workspace Toolbox
The Workspace Toolbox is located in the top-left corner of the canvas and provides quick access to common workspace actions.
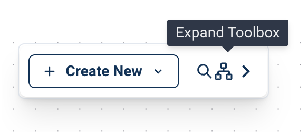
Select the expand arrow to show the full Toolbox.

The following tools are available:
| Tool | Description |
|---|---|
Create New |
A dropdown for creating new adapters, bridges, combiners, and node groups directly from the Workspace. |
Search bar |
Search for specific nodes by name. Use the left and right arrow buttons to cycle through matching results. Useful for navigating large topologies. |
Filter Workspace |
Opens a side panel with filtering options to hide entities from the canvas and focus on a specific subset of nodes. Select Clear Filters to restore the default view. |
Layout |
A dropdown for selecting a canvas layout. The default setting is Manual. Select Apply Layout to apply your chosen layout. |
Saved Presets |
Save the current canvas layout as a named preset, or switch to a previously saved layout. |
Layout Configuration |
Opens a side panel with additional layout management options. |
Guided Creation Wizard
The Create New option in the Toolbox opens a dropdown for creating new entities in HiveMQ Edge directly from the Workspace canvas.

To create a new entity, select an entity type from the dropdown:
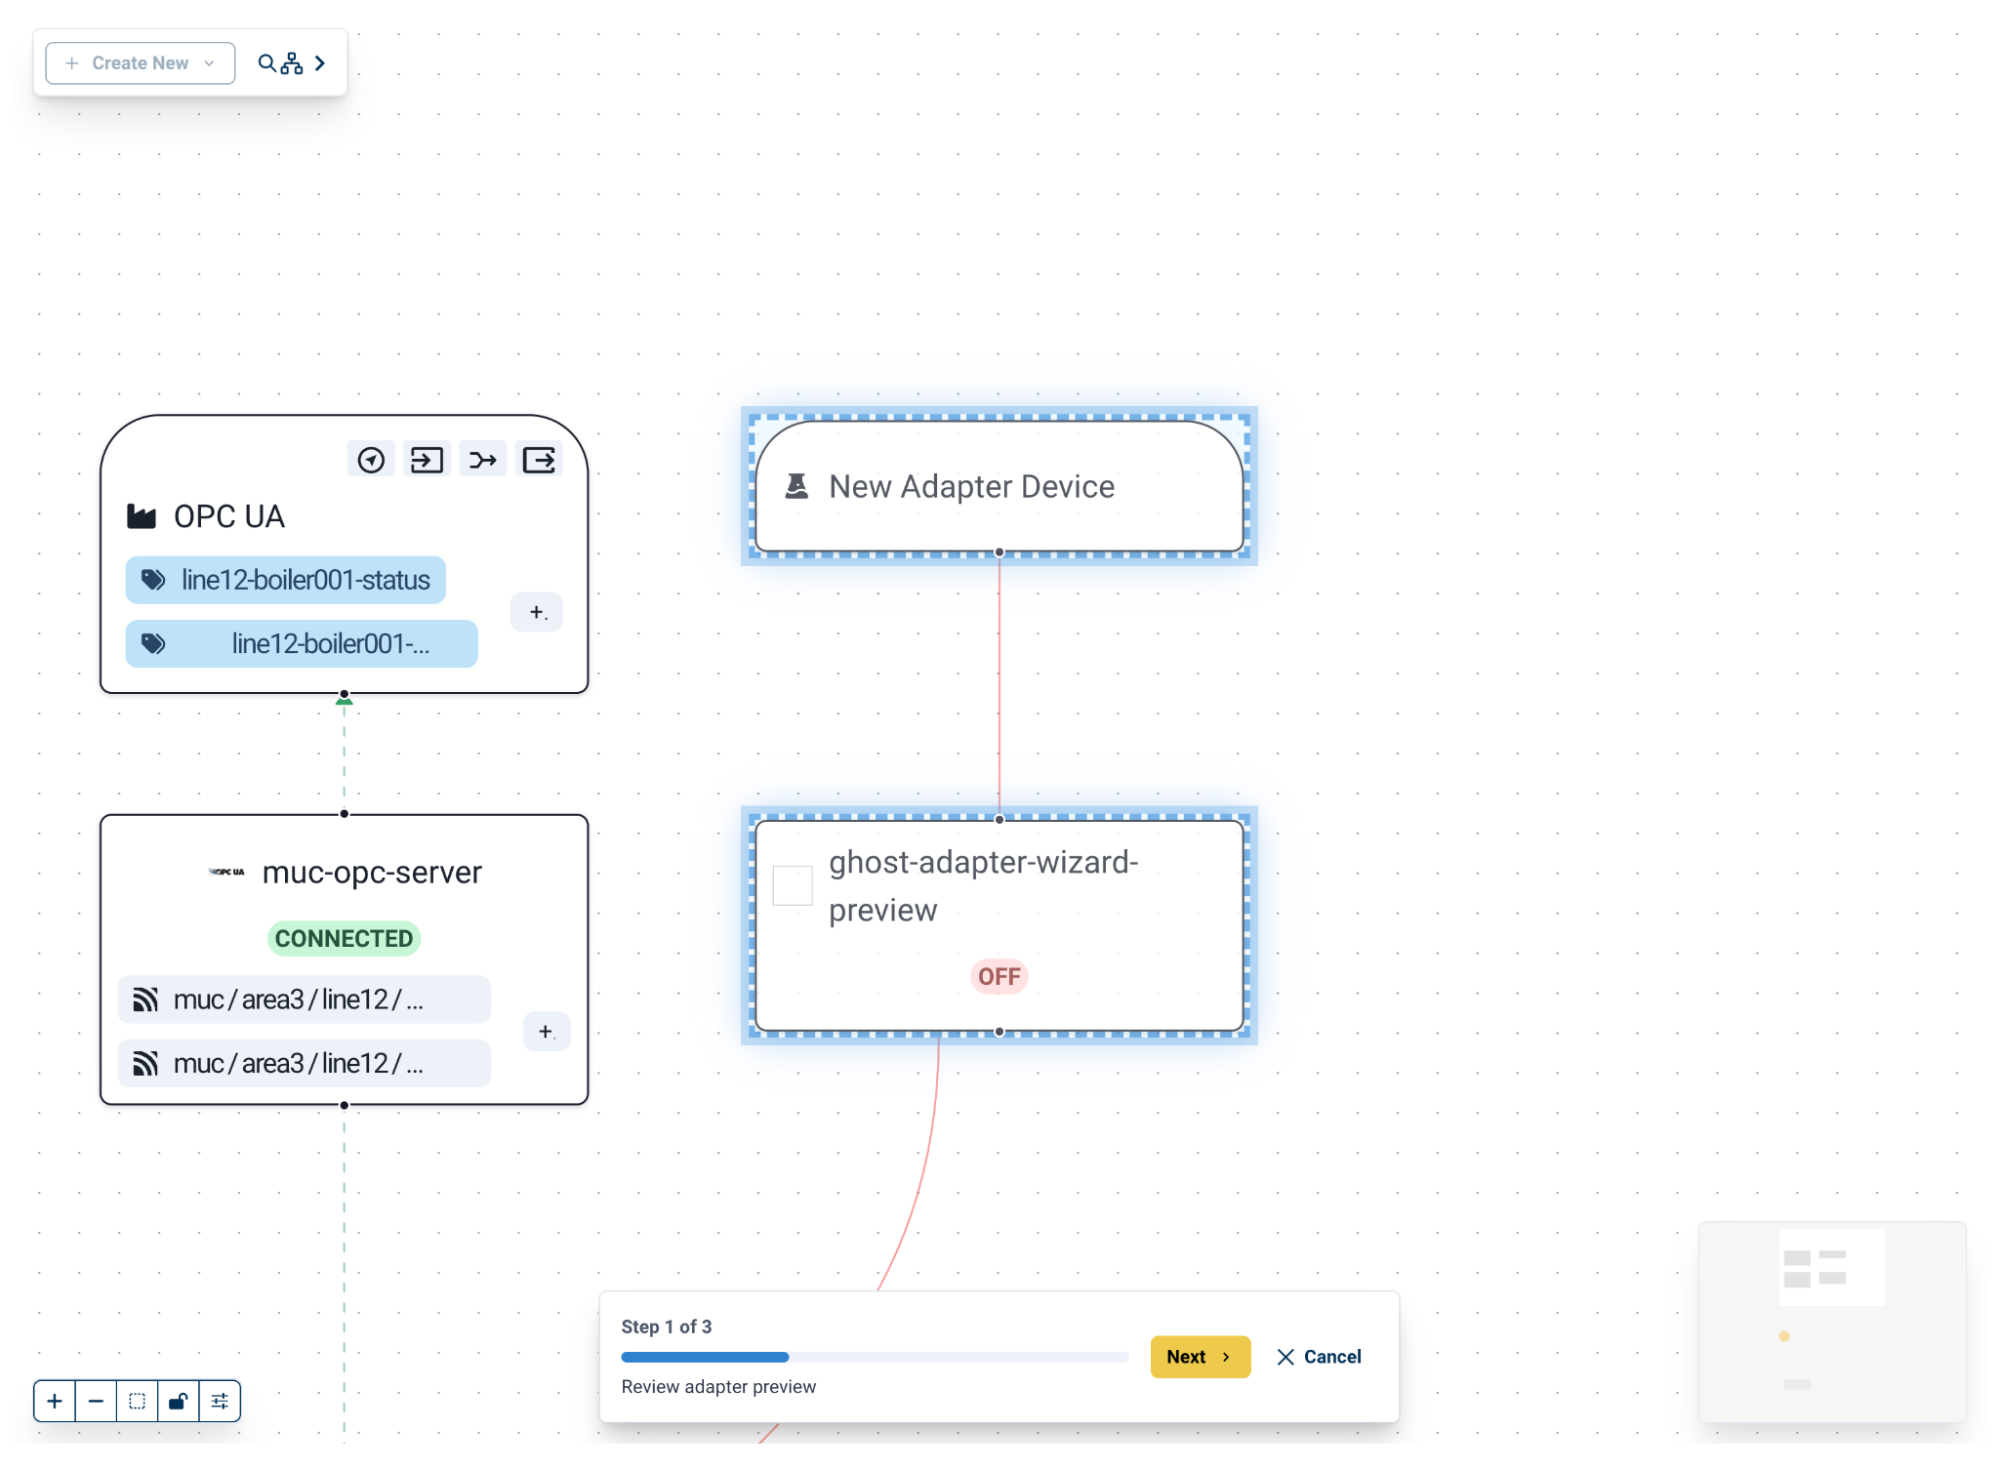
When you create an entity, the Workspace zooms to the relevant area of the canvas and displays a ghost node. Ghost nodes provide a visual representation of the entity being created. Click Next in the progress bar at the bottom of the view to proceed to the configuration stage.
Users can then make selections and configurations for entities as they would outside of the Workspace canvas.
When the configuration is complete, use the provided call to action to commit the configuration to HiveMQ Edge.
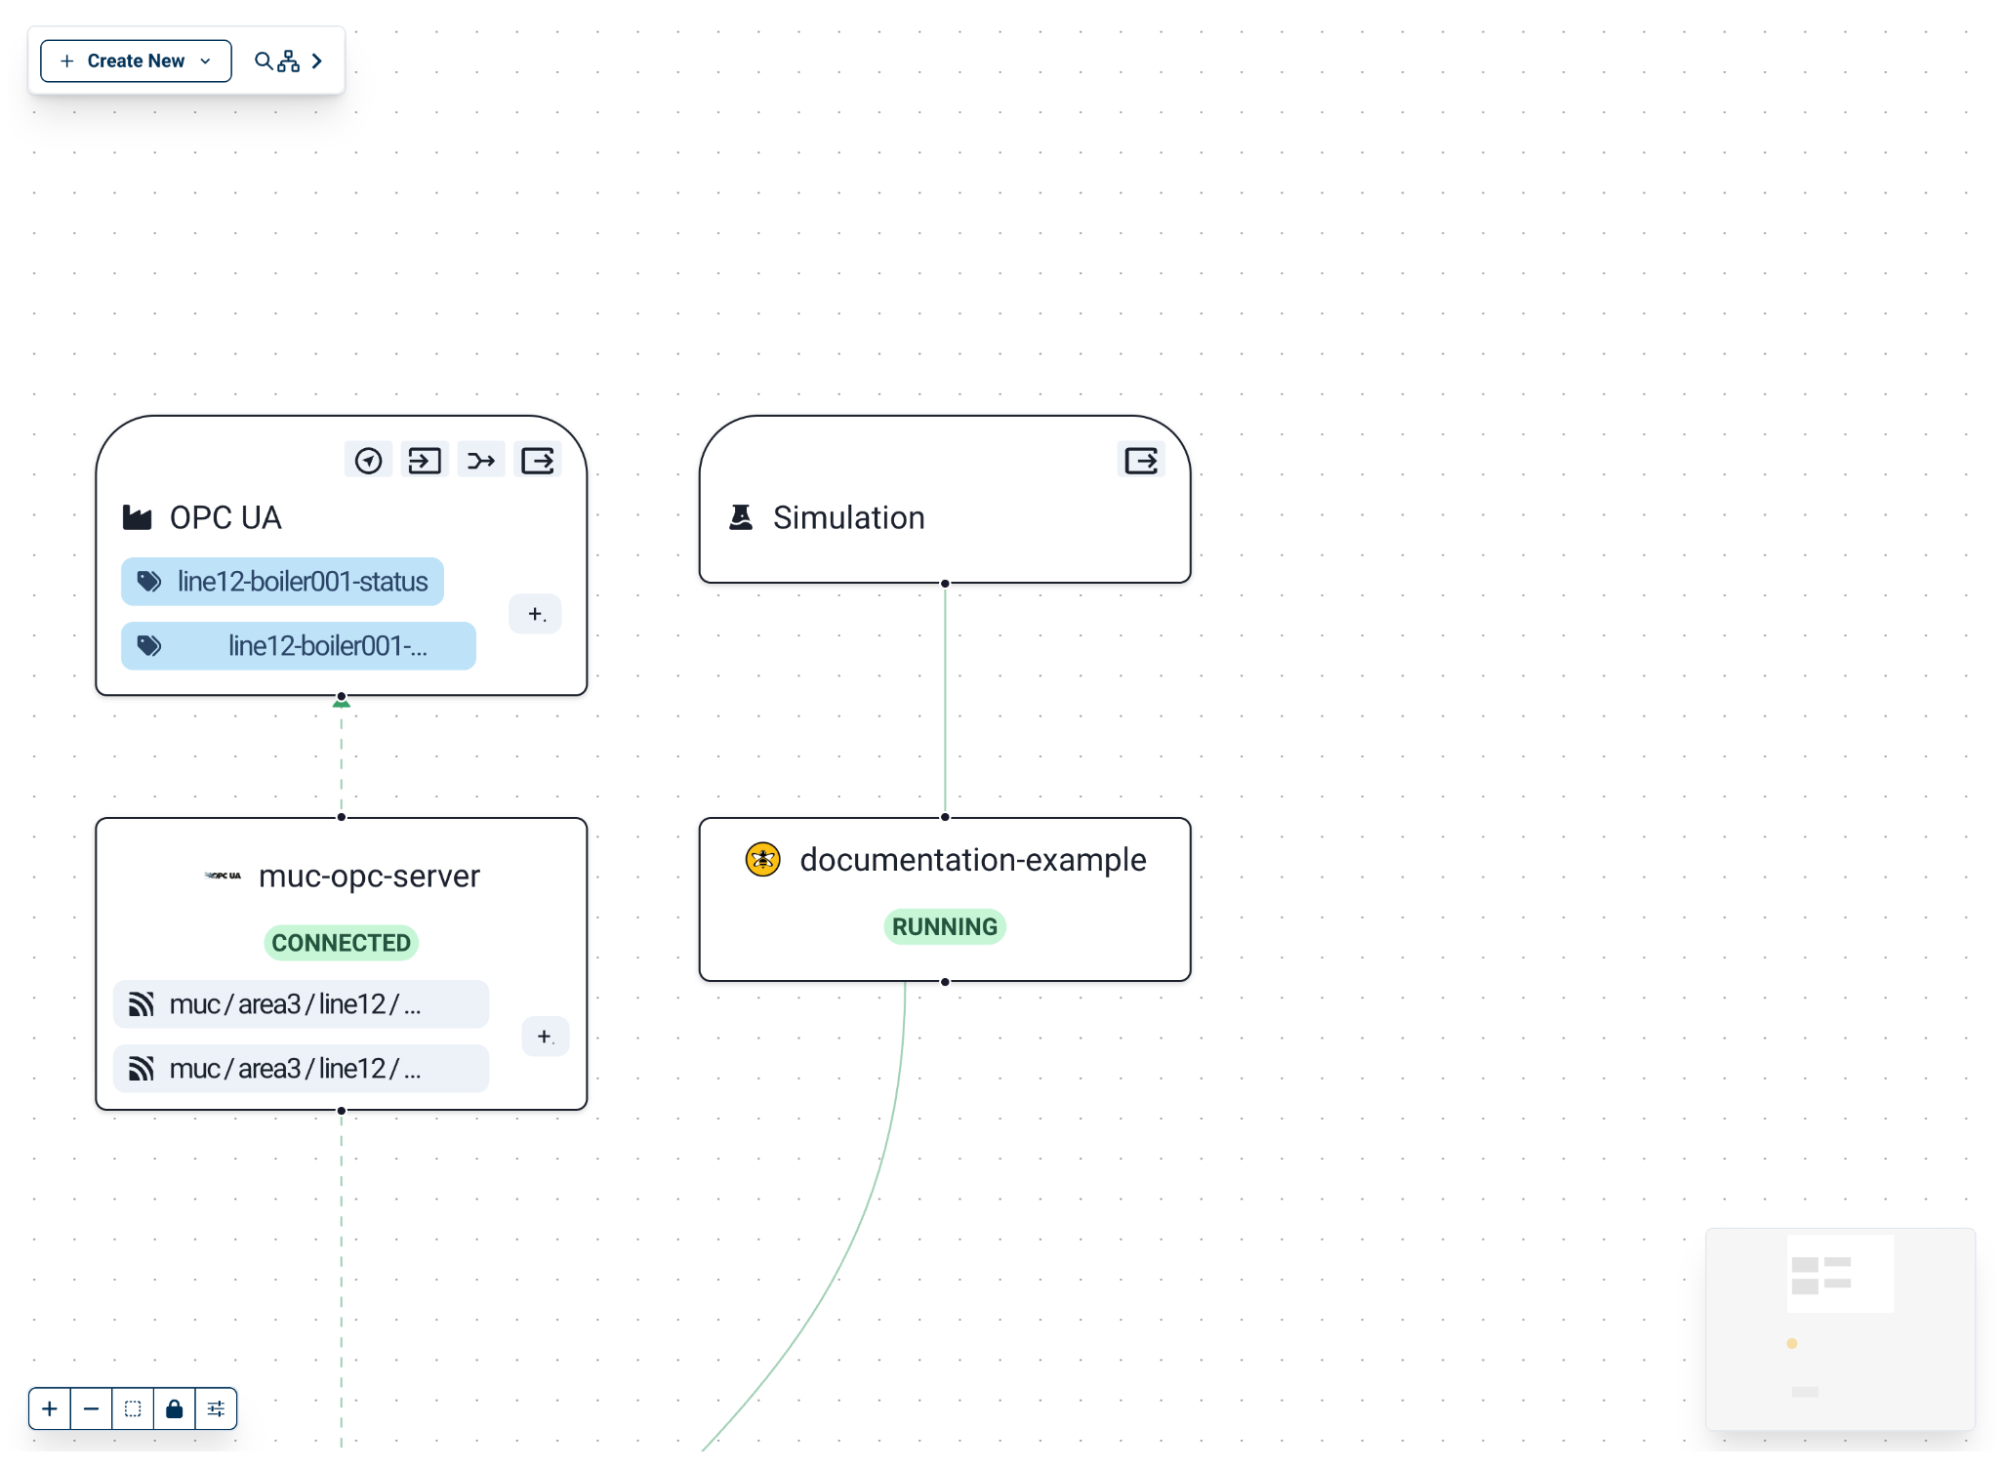
The Workspace canvas returns and the new entity nodes are populated with your configuration.
Filter Workspace
Select Filter Workspace in the Toolbox to open the filter side panel.
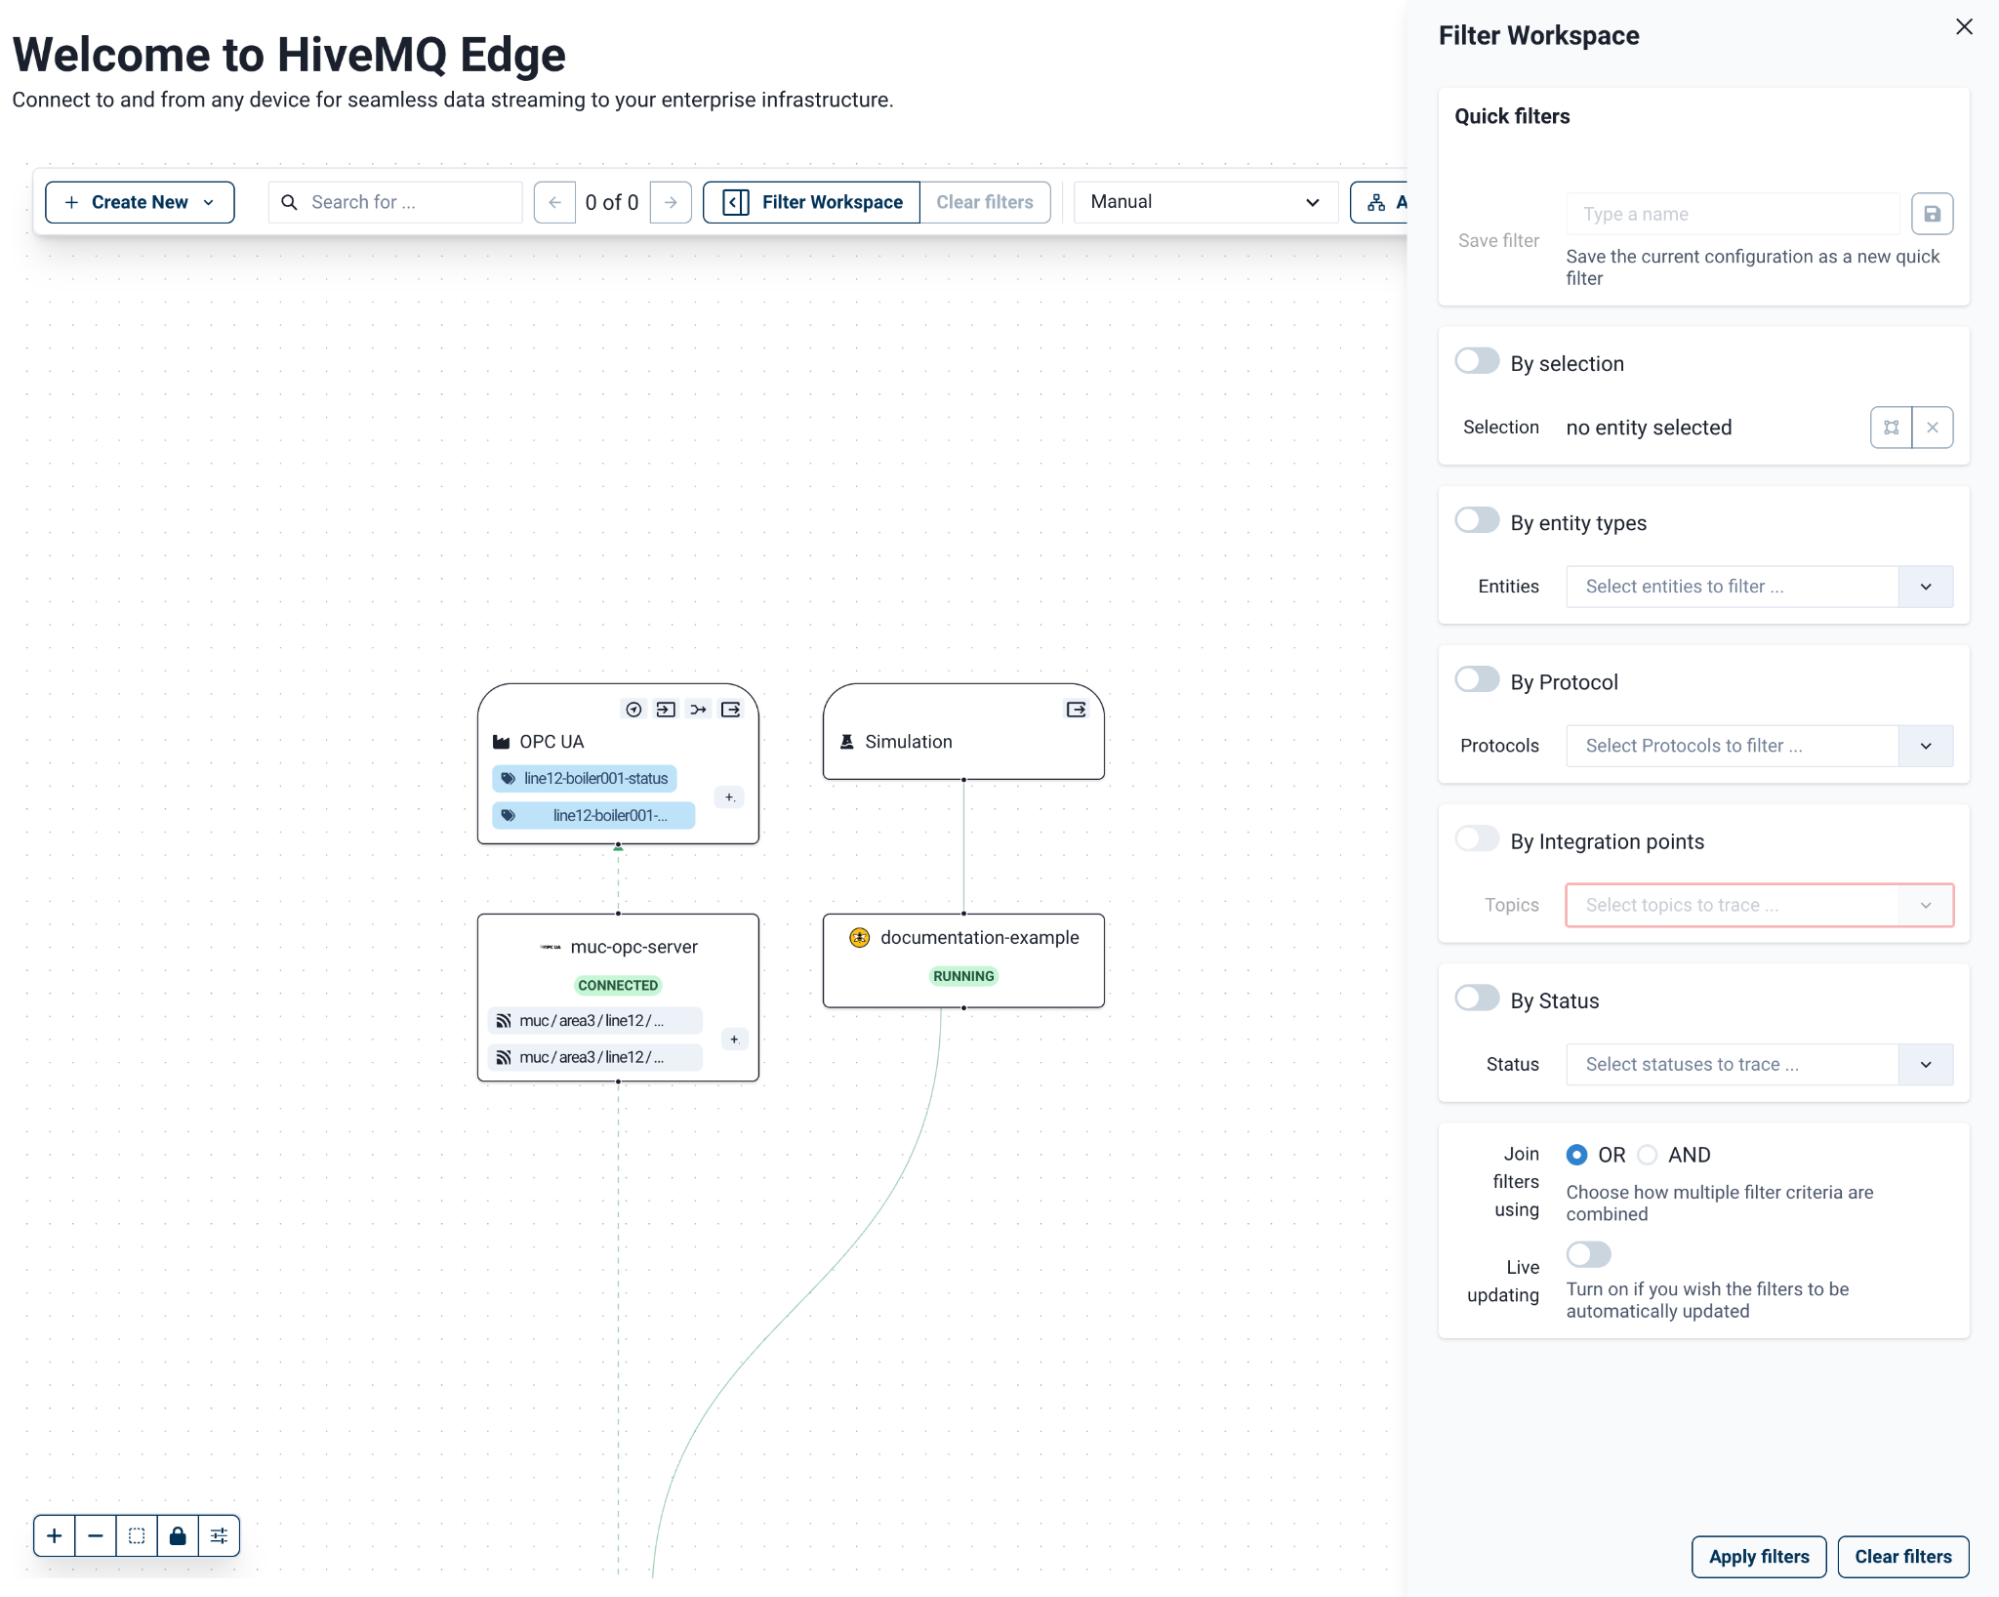
The following filter options are available:
| Filter | Description |
|---|---|
Quick Filters |
Select a previously saved filter view or save the current one. |
By Selection |
Show only the currently selected nodes. |
By Entity Types |
Show only specific entity types, such as protocol adapters or bridges. |
By Integration Points |
Filter the view to show the pathway of a specific MQTT topic. |
By Status |
Show entities based on their current status. |
Filter logic pane |
Combine multiple filters using AND/OR logic. Enable real-time updates to apply filter changes as you make them. |
To apply your filter configuration, click Apply Filters. To reset the view to its default state, click Clear Filters.
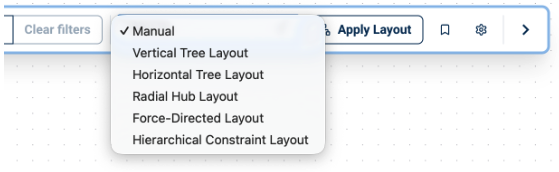
Workspace Layouts
The Layout dropdown in the Workspace Toolbox provides the following layout options:
| Layout | Description |
|---|---|
Manual (default) |
Drag and drop nodes freely on the canvas. |
Vertical Tree |
Arranges nodes in a top-to-bottom flow. |
Horizontal Tree |
Arranges nodes in a left-to-right flow. |
Radial Hub |
Centers the broker node with connections radiating outward. |
Force-Directed |
Groups nodes based on their relationships and connections. |
Hierarchical Constraint |
Arranges nodes in layers from top to bottom. |
To apply the selected layout, click Apply Layout. To return to the default layout, reset the canvas.
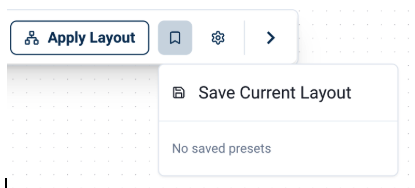
To save layouts or re-use saved layouts, click the bookmark icon in the Workspace Toolbox menu.
To open the Layout Configuration panel, click the cog icon in the Workspace Toolbox menu.
| Configuration options are only available for non-Manual layouts. |
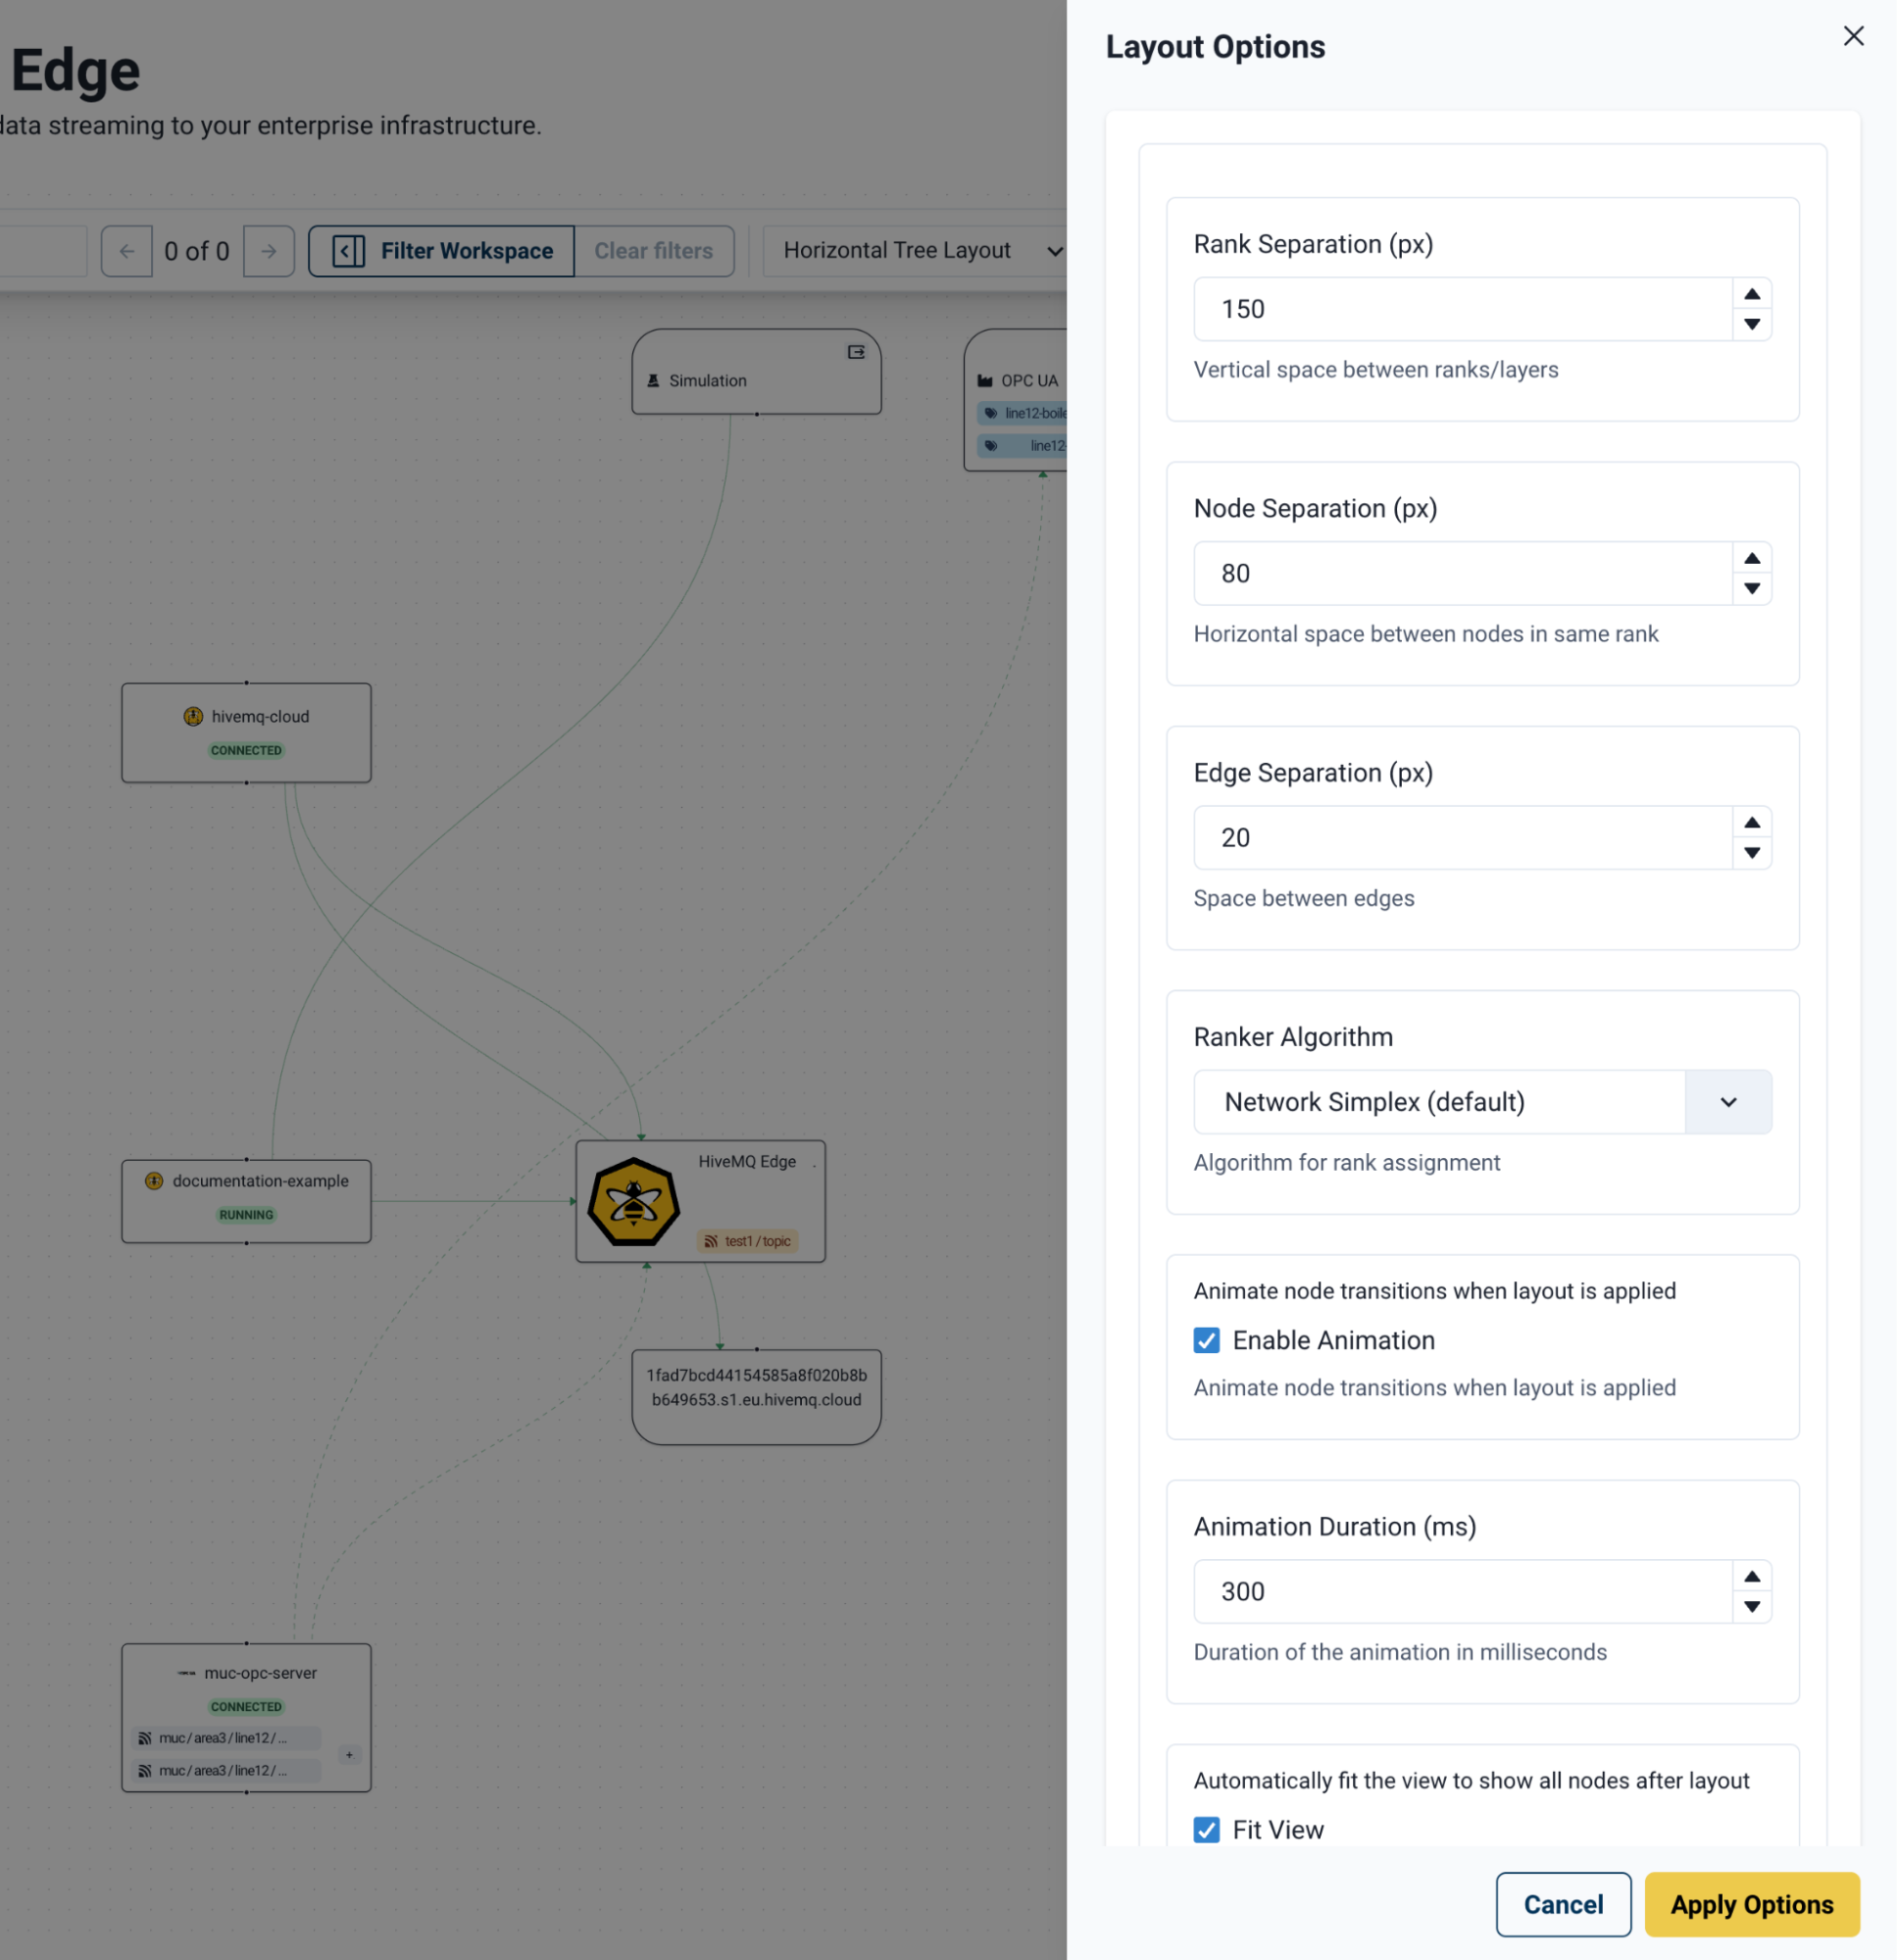
The options vary per layout. Each option includes a label to help you understand the visual effects. To apply changes, click Apply Options in the bottom right corner of the canvas. To save your layout preferences, click the bookmark icon.
Canvas Toolbar
The Canvas Toolbar is always visible in the bottom-left corner of your HiveMQ Edge Workspace.

The Canvas Toolbar provides the following controls:
| Zoom in (+) | Increases magnification on a specific area of the Workspace. |
|---|---|
Zoom out (-) |
Decreases magnification on a specific area on the Workspace. |
Fit to the canvas (dotted box) |
Centers all the nodes within the canvas window. |
Lock the canvas (padlock) |
Prevents nodes from moving on the Workspace while you navigate and select. |
Workspace configuration (sliders) |
Opens the Workspace configuration panel. |
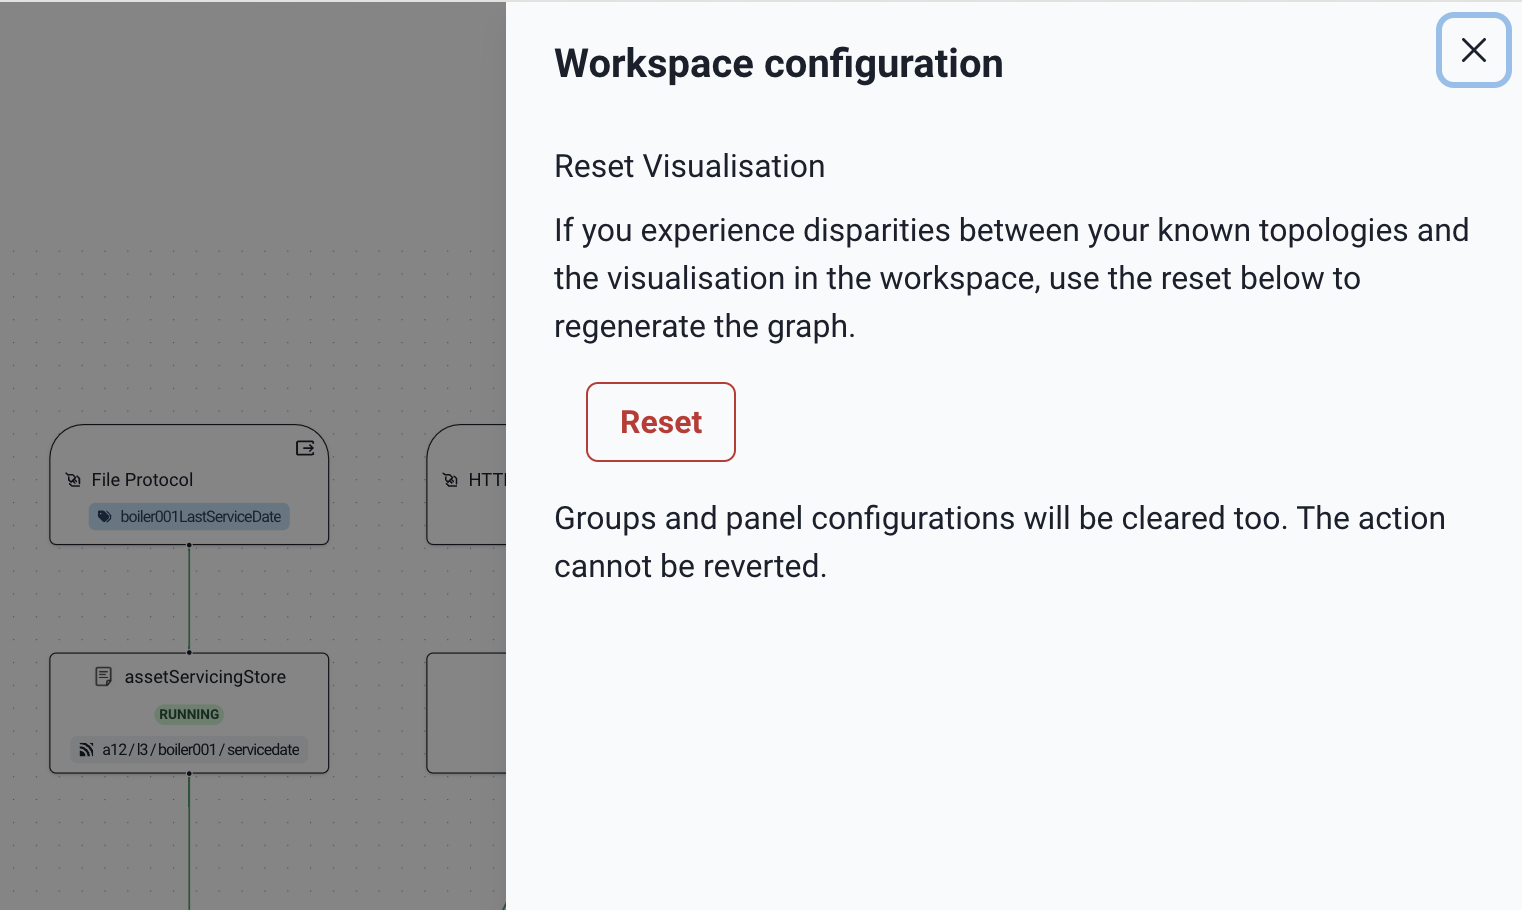
Workspace Configuration Panel
The sliders icon opens the Workspace configuration panel.
To remove changes made to the configuration of your running HiveMQ Edge instance or the HiveMQ Edge Workspace canvas, click Reset Visualisation.
| The Reset Visualisation option removes all group and panel configurations from the Workspace canvas. This action cannot be undone. Resetting the visualization, does not affect the configuration of your running HiveMQ Edge instance. |
Workspace Elements
Nodes on the canvas are connected by colored lines called links. Link colors indicate the status of the data relationship between nodes:
-
Green : Healthy connection with an active data flow.
-
Red: Connectivity issue present. Check the connection status or configuration.
-
Black: Data relationship between nodes, no active flow.
Observability Panels
An analytics symbol on a link line indicates an active MQTT data flow between nodes.

Select the analytics symbol to open the associated Observability Panel
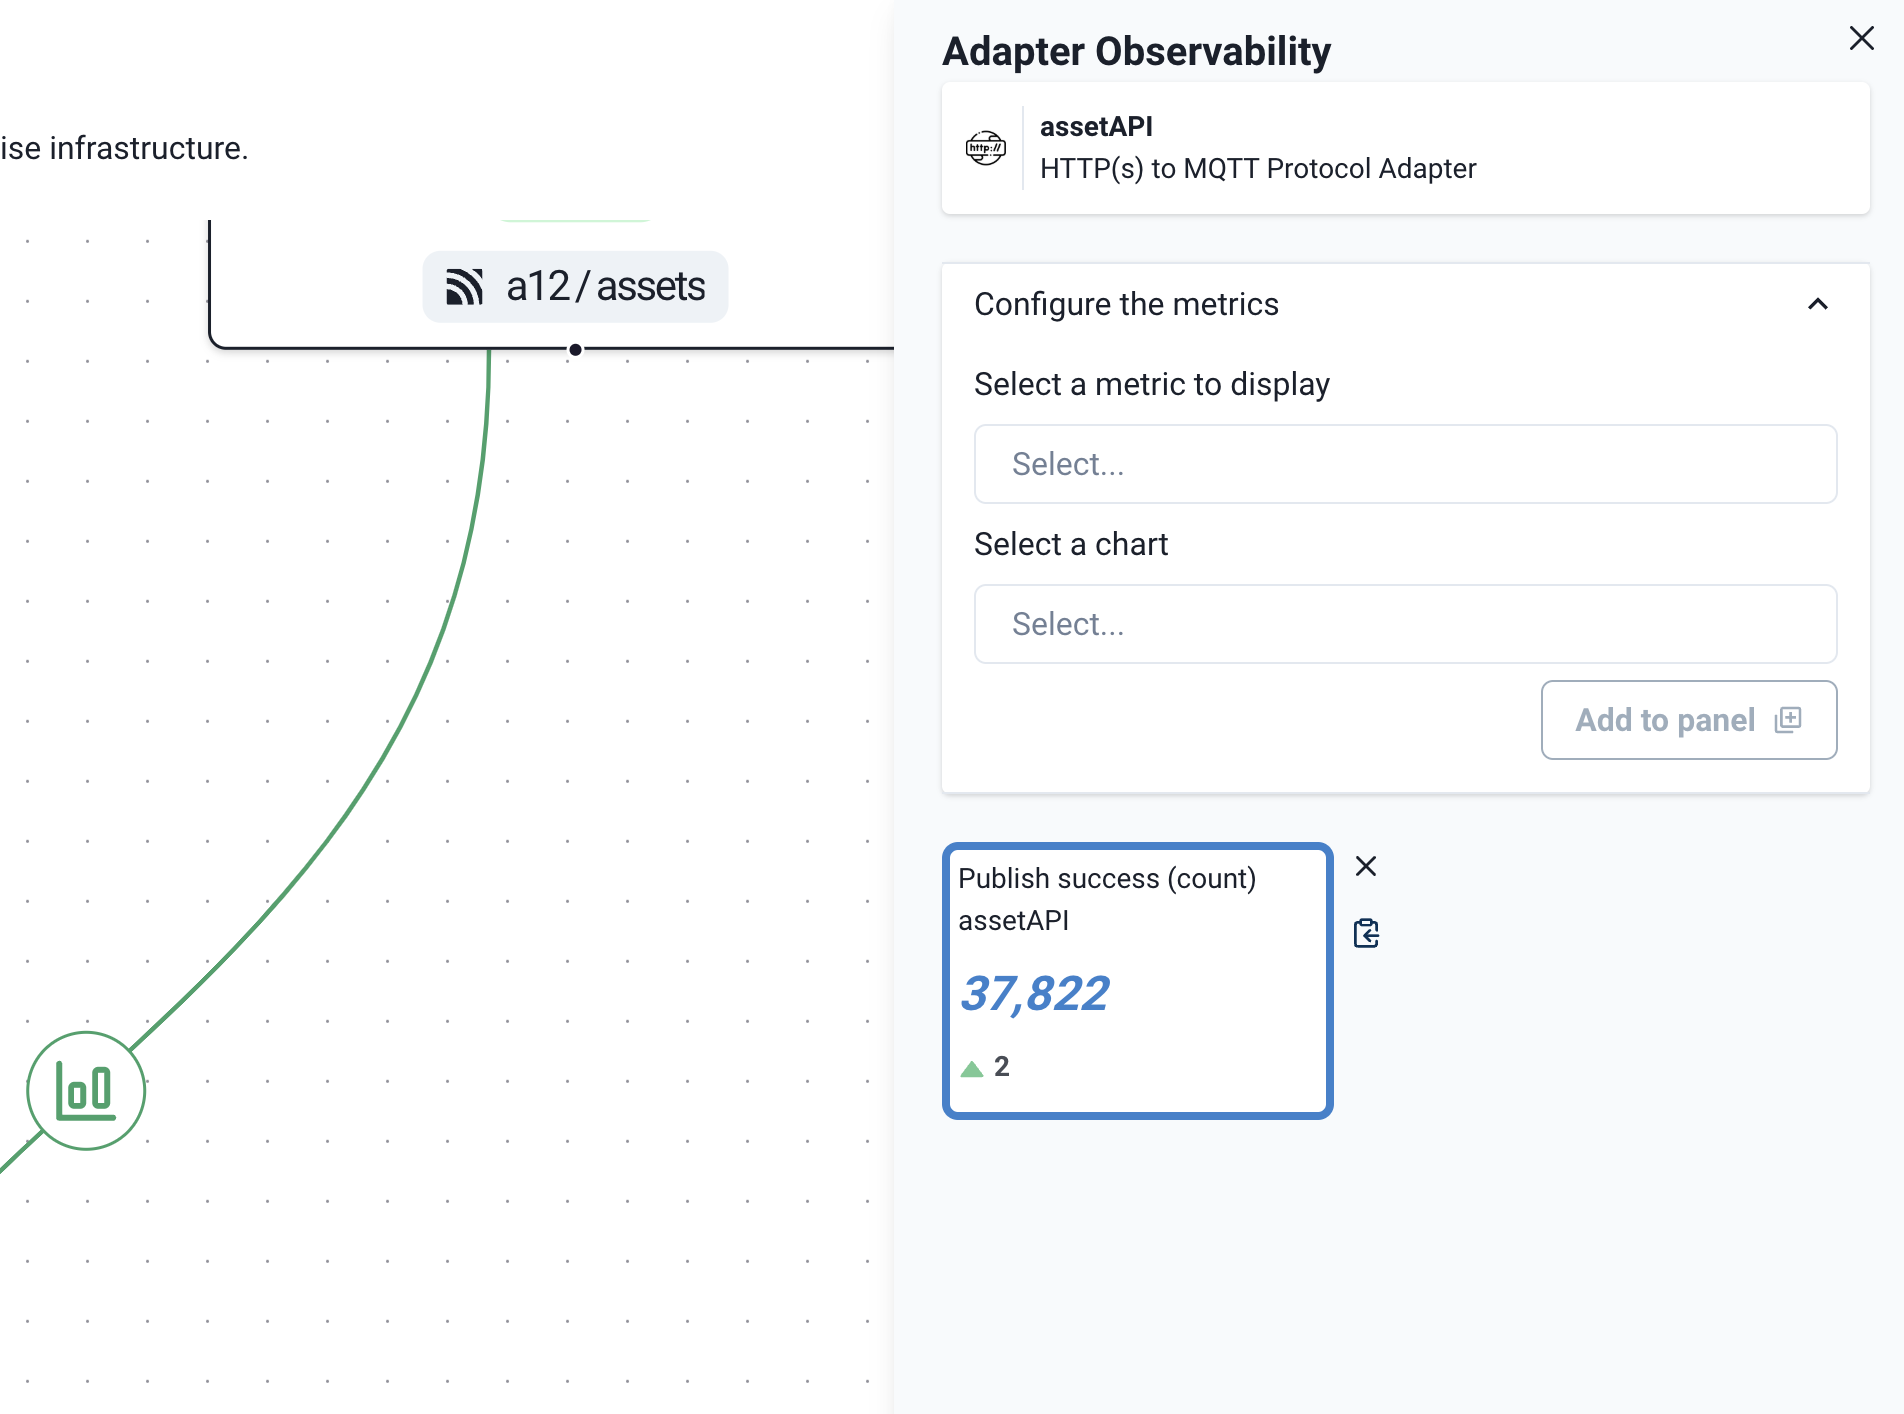
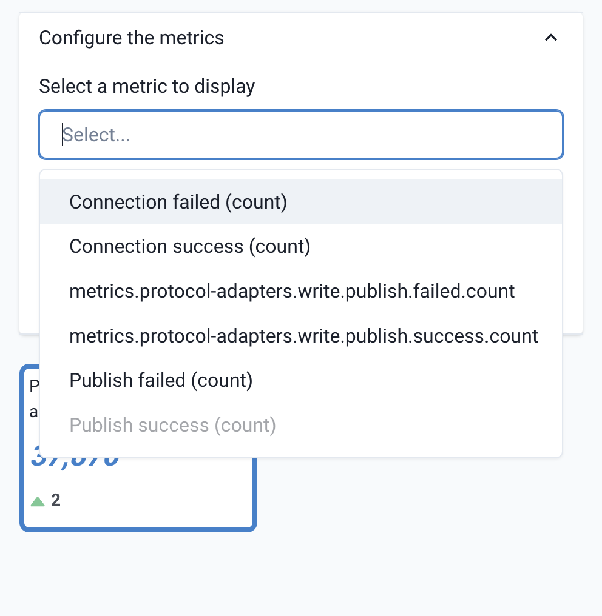
By default, each observability panel provides a Publish success (count) metric. To add further metrics, select the Configure the metrics option on the panel. The panel automatically adjusts to list the available metrics and view types.
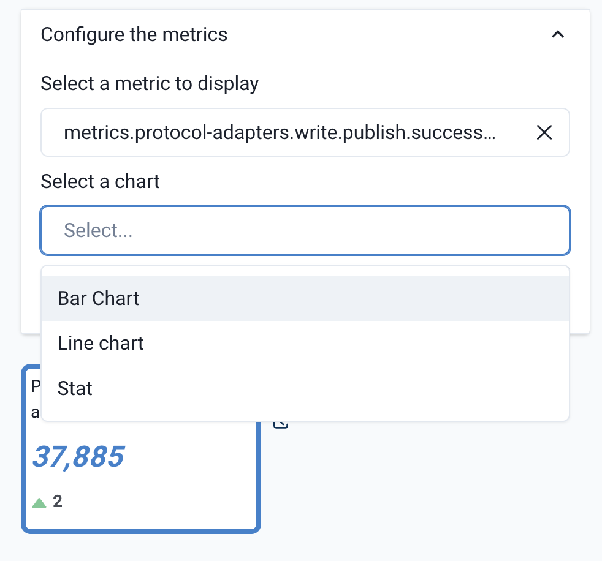
To add a metric or view type, select Add to panel.
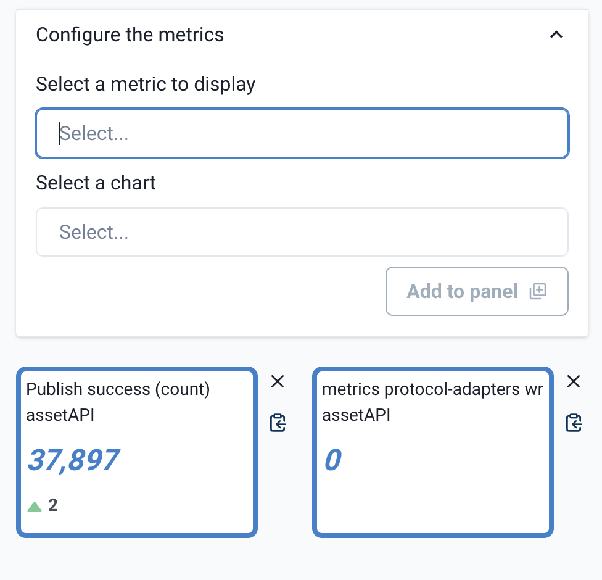
| Metric persistence is not supported. Values are computed from the moment the observability panel opens. When you close the panel, all values except the last one are discarded. |
Group Adapters
Protocol Adapter nodes can be grouped on the canvas to provide group views in your Observability Panels. To create a group, drag and select or modifier-click multiple Protocol Adapter nodes to initiate a group.
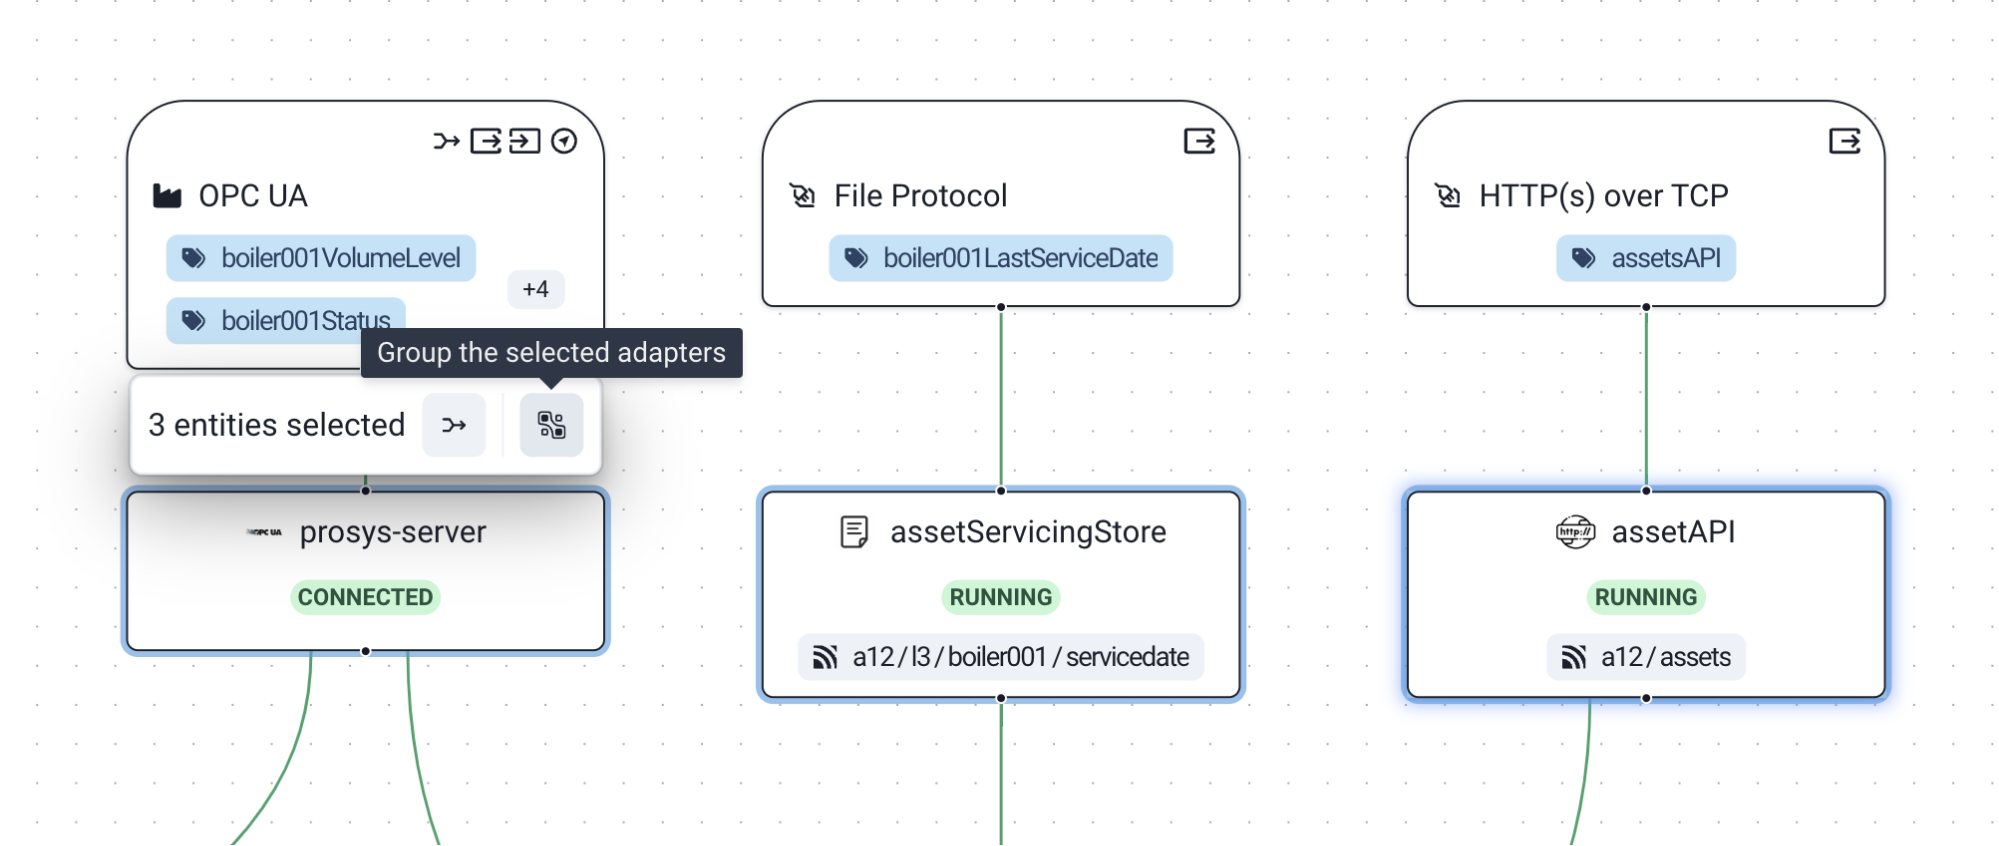
Next, select the Group the selected adapters from the overlay toolbar.

This action creates an Untitled group on the canvas.
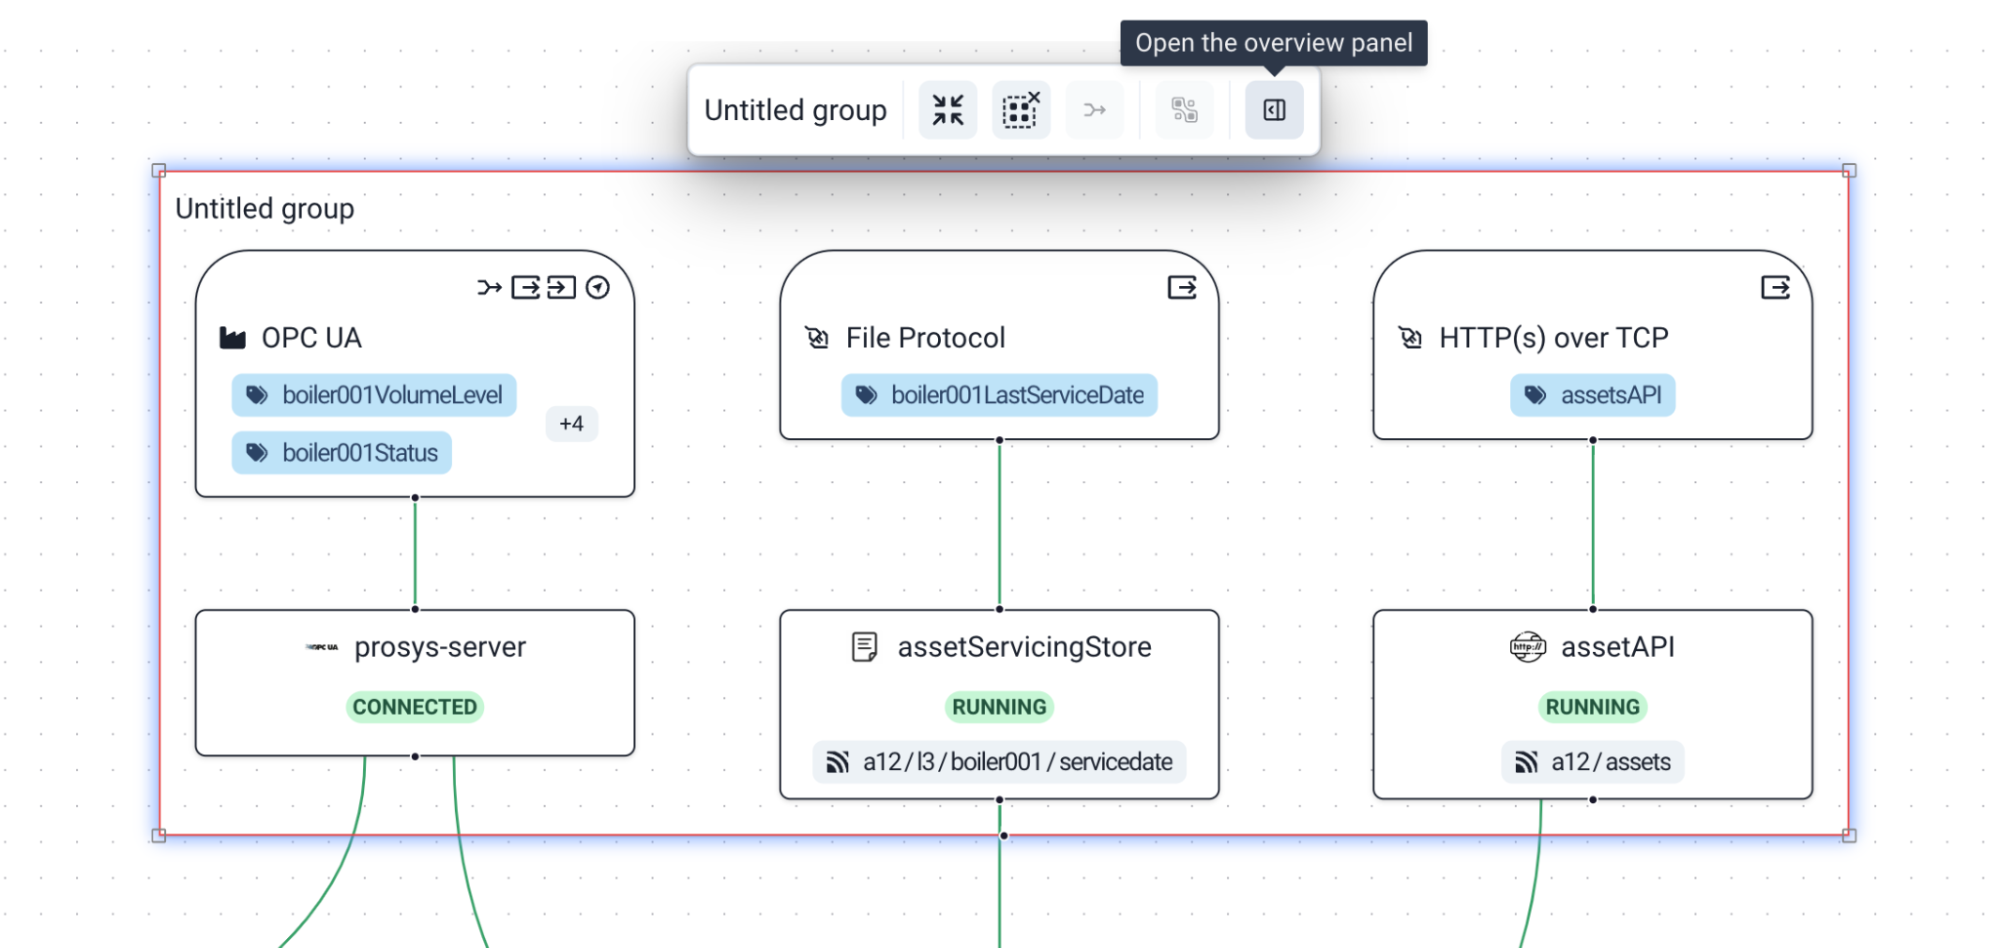
Select the group node to access the following Overlay Toolbar options:
-
Collapse group (four converging arrows): Collapses the connectivity lines for all the nodes into a single line.
-
Ungroup (box with an x): After a confirmation, ungroups the nodes.
-
Open the overview panel (sidebar icon): Opens an Overview Panel on right side of the screen.
| Not all nodes can be grouped. Currently, only adapter nodes can be grouped. Other node types can not be added to the group. Nodes in a group cannot be added to another group. |
Group Observability Panel
To access the Observability panel, select Open the overview panel on the group overlay toolbar. The panel opens from the right side of the screen.
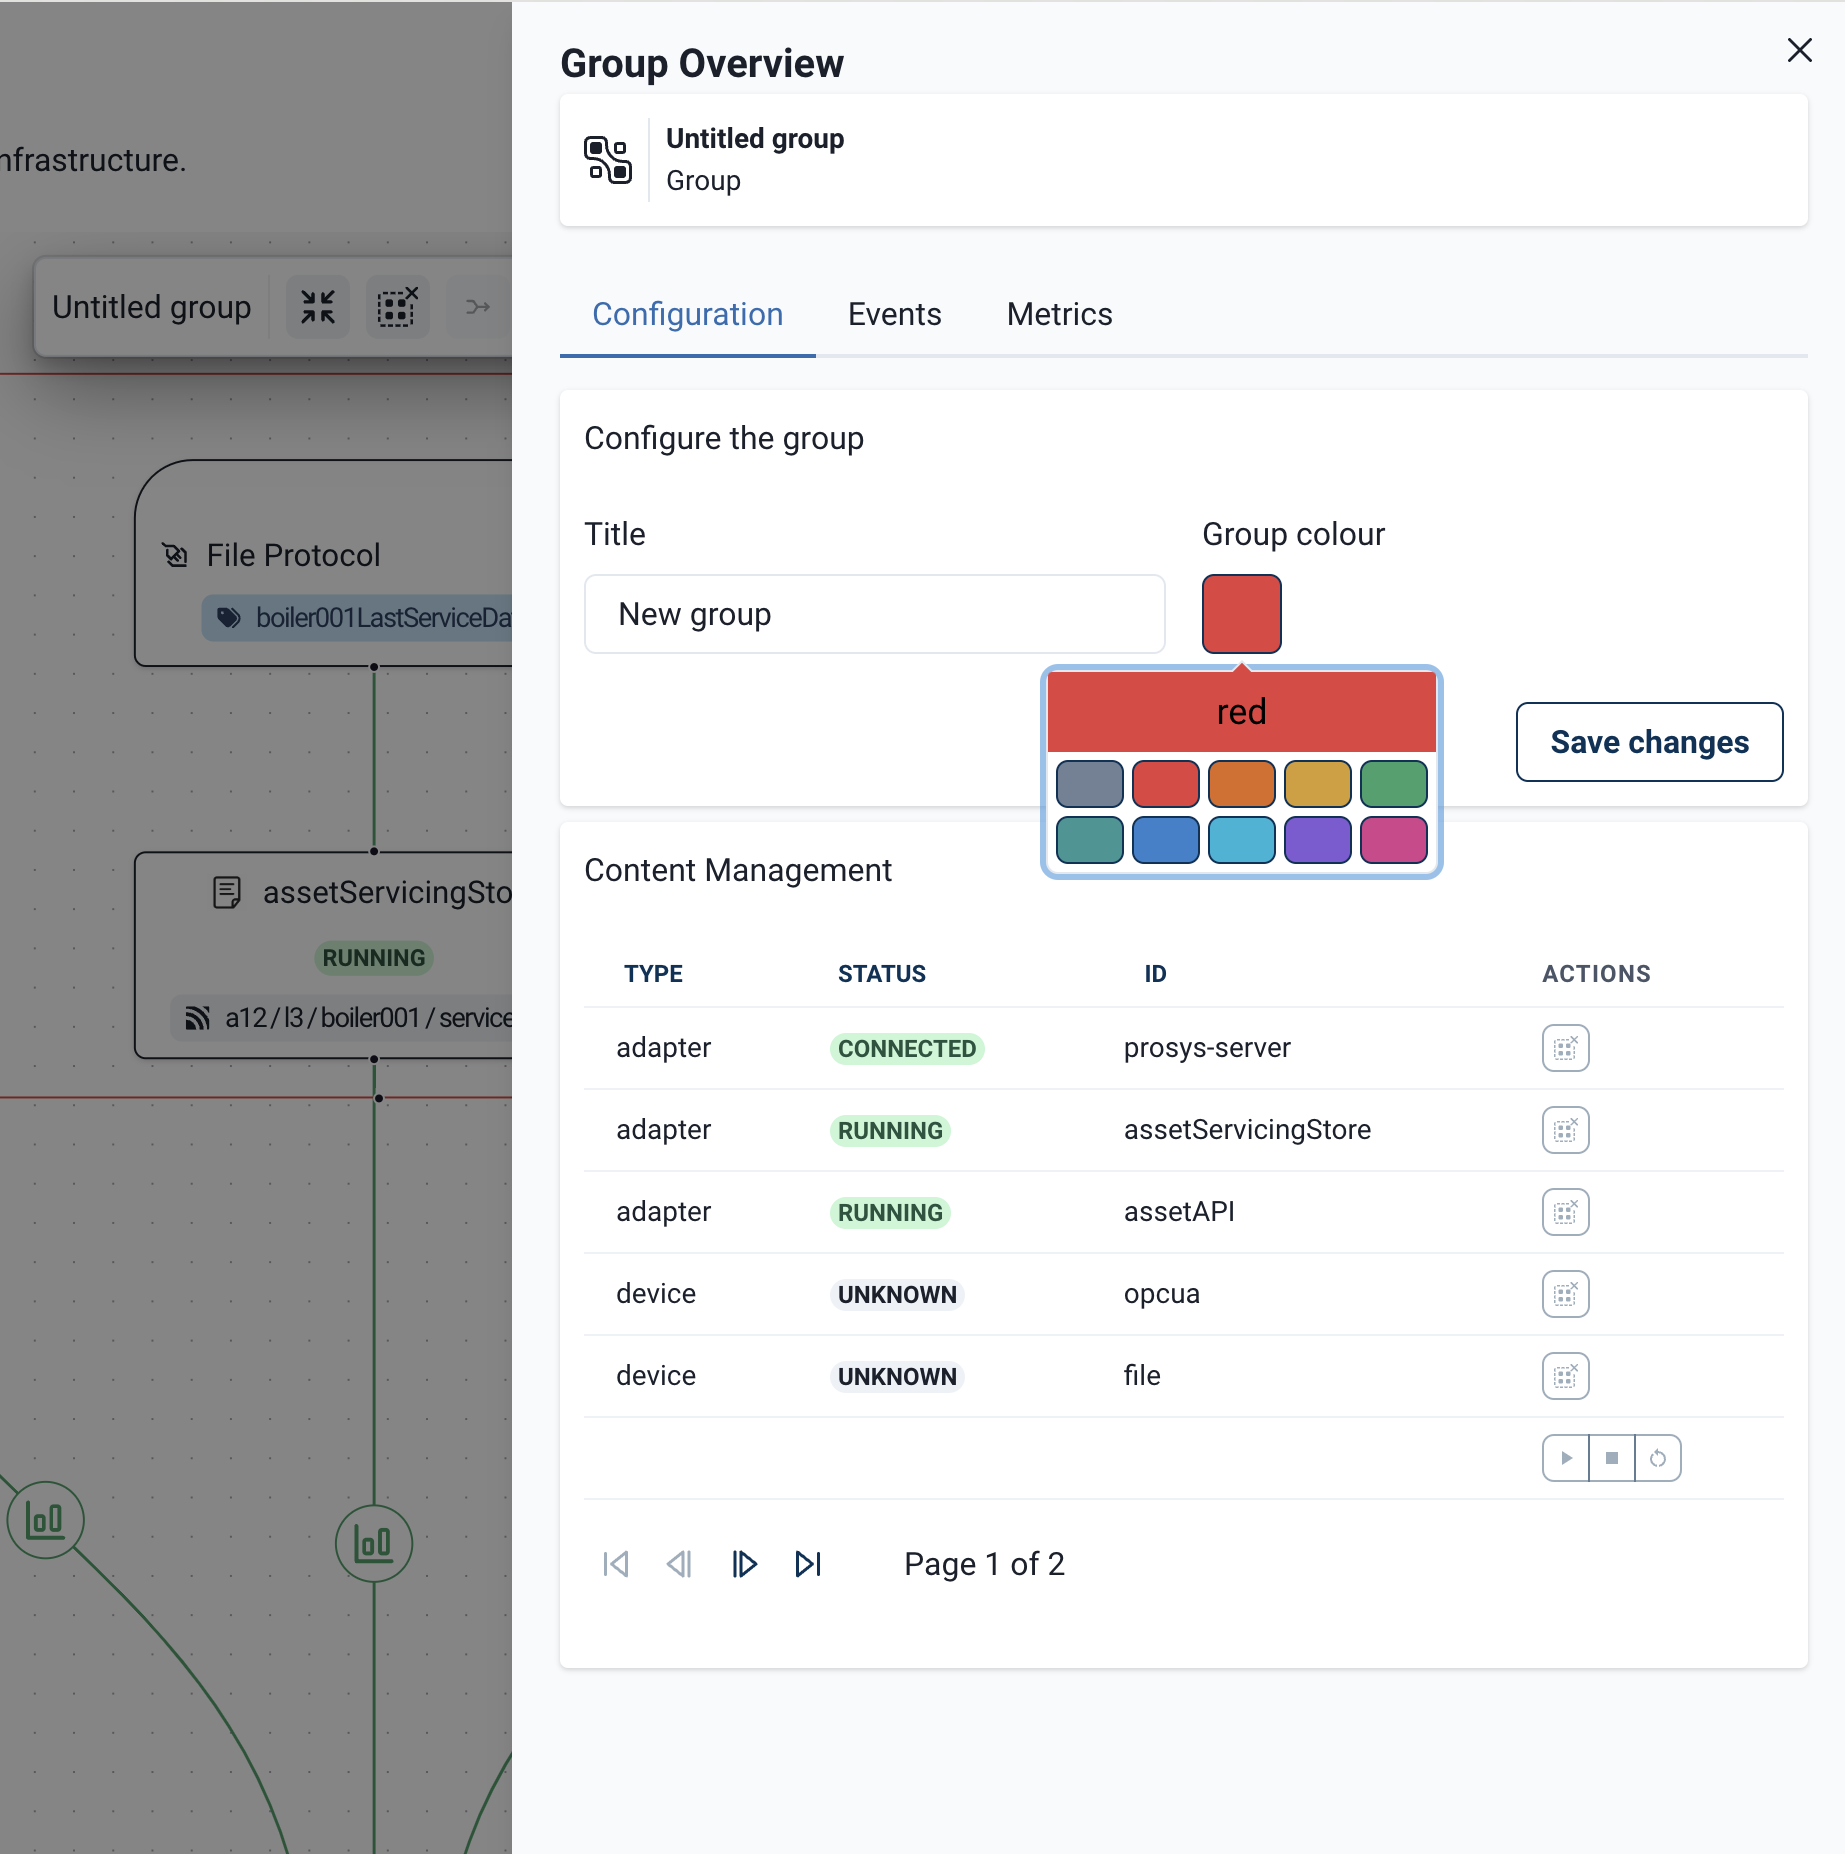
The Observability panel has three tabs:
-
Configuration: Labeling and display options for the group.
-
Events: Event log entries related to the grouped protocol adapters.
-
Metrics: A combined metrics view from the individual Observability Panels.
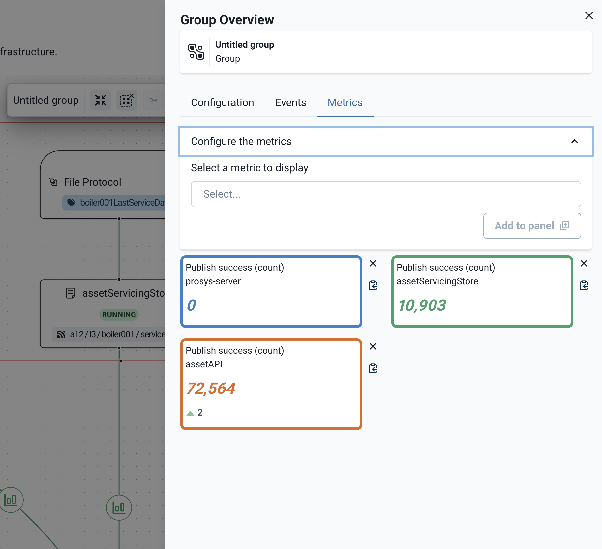
To close the panel, select X in the upper-right corner.
Workspace Nodes
The Workspace canvas displays up to seven node types:
| Node Type | Description |
|---|---|
HiveMQ Edge Broker node |
The central node on the canvas that represents the MQTT broker within HiveMQ Edge. |
Bridge Configuration node |
One or more configured MQTT bridge connections for message publication and/or subscription. |
Bridge Destination node |
The remote endpoint configured in a bridge connection. |
Protocol Adapter node |
The configured protocol adapter connection to which MQTT topics are mapped. |
Device node |
The device associated with a protocol adapter and the mapped tags associated with the device. |
Combiner node |
A configured data combination and its related sources. |
Asset Mapper node |
A configured data combination that uses an asset-defined destination. This is a specialized variant of the Combiner node. |
Broker Node
The HiveMQ Edge Broker node is always at the center of the Workspace canvas diagram. In terms of connectivity, this node represents the MQTT broker within the HiveMQ Edge instance. The HiveMQ Edge logo labels the Broker node. If the node is configured, it displays topic filters.
When you select the Broker node on the canvas, an overlay toolbar displays.
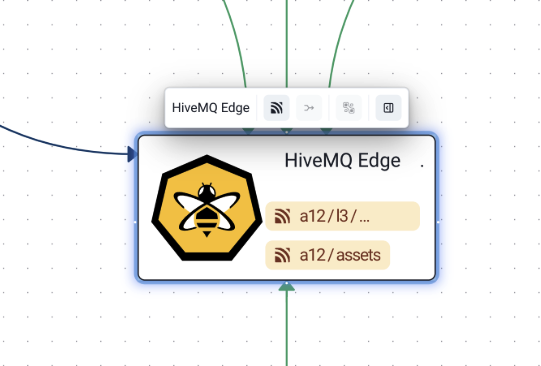
The overlay toolbar of the HiveMQ Edge Broker node provides the following options:
| Option | Icon | Description |
|---|---|---|
Manage topic filters |
MQTT icon |
Opens the Manage topic filters window. |
Create a data combiner from selection |
Combination icon |
Create a data combination from topic filters. This option is only visible when the Broker node and at least one other data source are selected. |
Open the overview panel |
sidebar icon |
Opens the Overview Panel from the right side of the screen. |
Topic Filters
To access topic filters, select Manage topic filters on the overlay toolbar of the HiveMQ Edge Broker node.
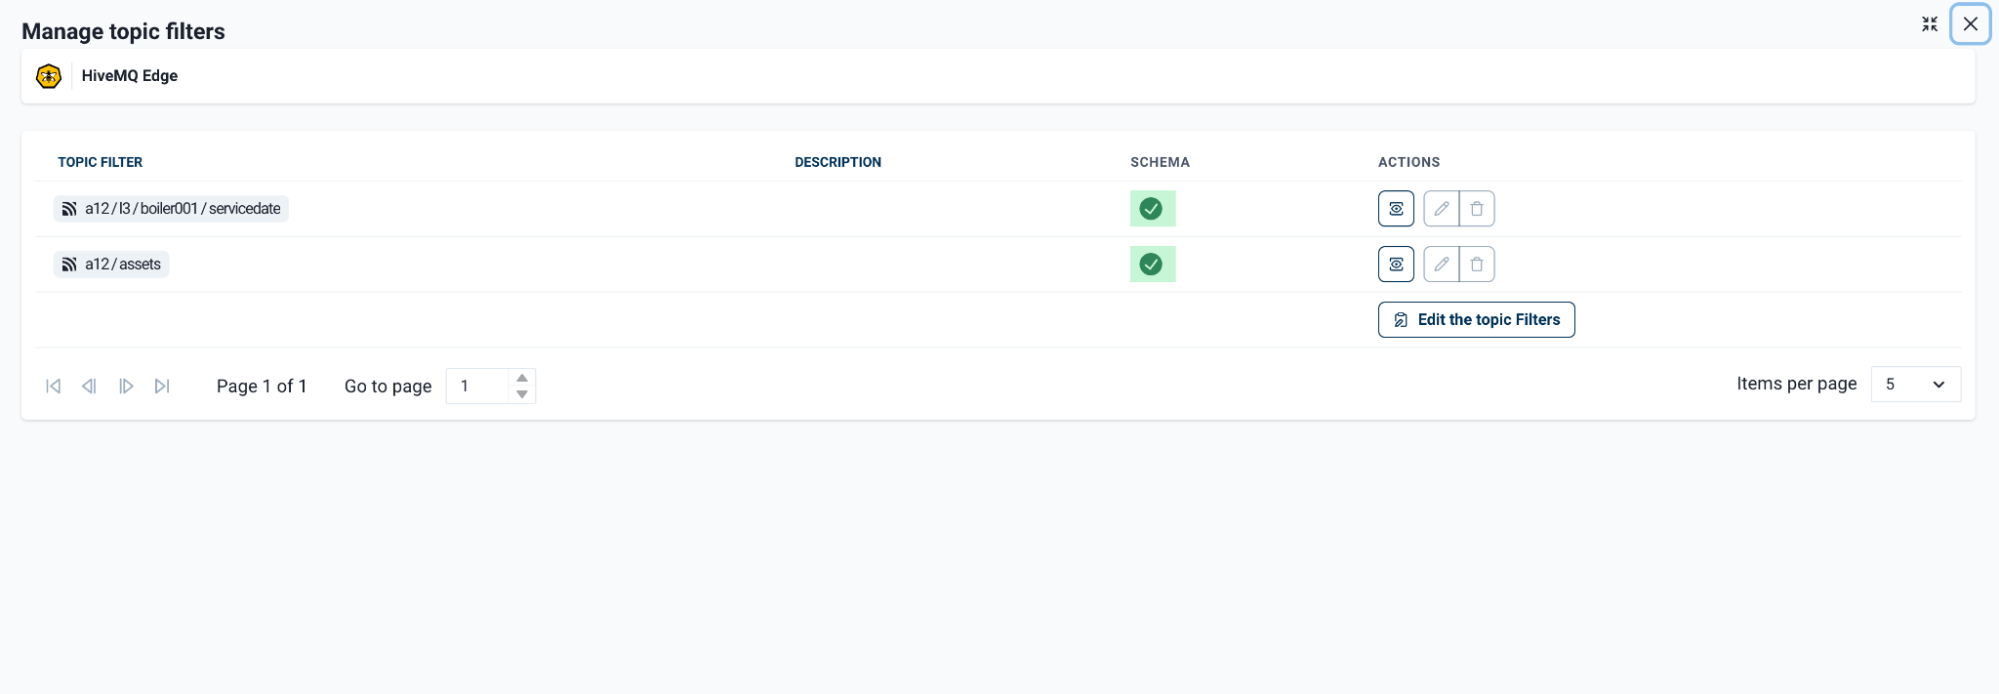
The Manage topic filters window lists existing topic filters in a paginated view. Each line item has an action toolbar that allows you to manage, edit, or delete topic filters.
To add a new topic filter or edit an existing entry, select Edit the topic filters. The List of topic filters side panel that enables you to manage existing filters or add a new one opens. To add a new topic filter, select + Add Item in the Topic Filters area.
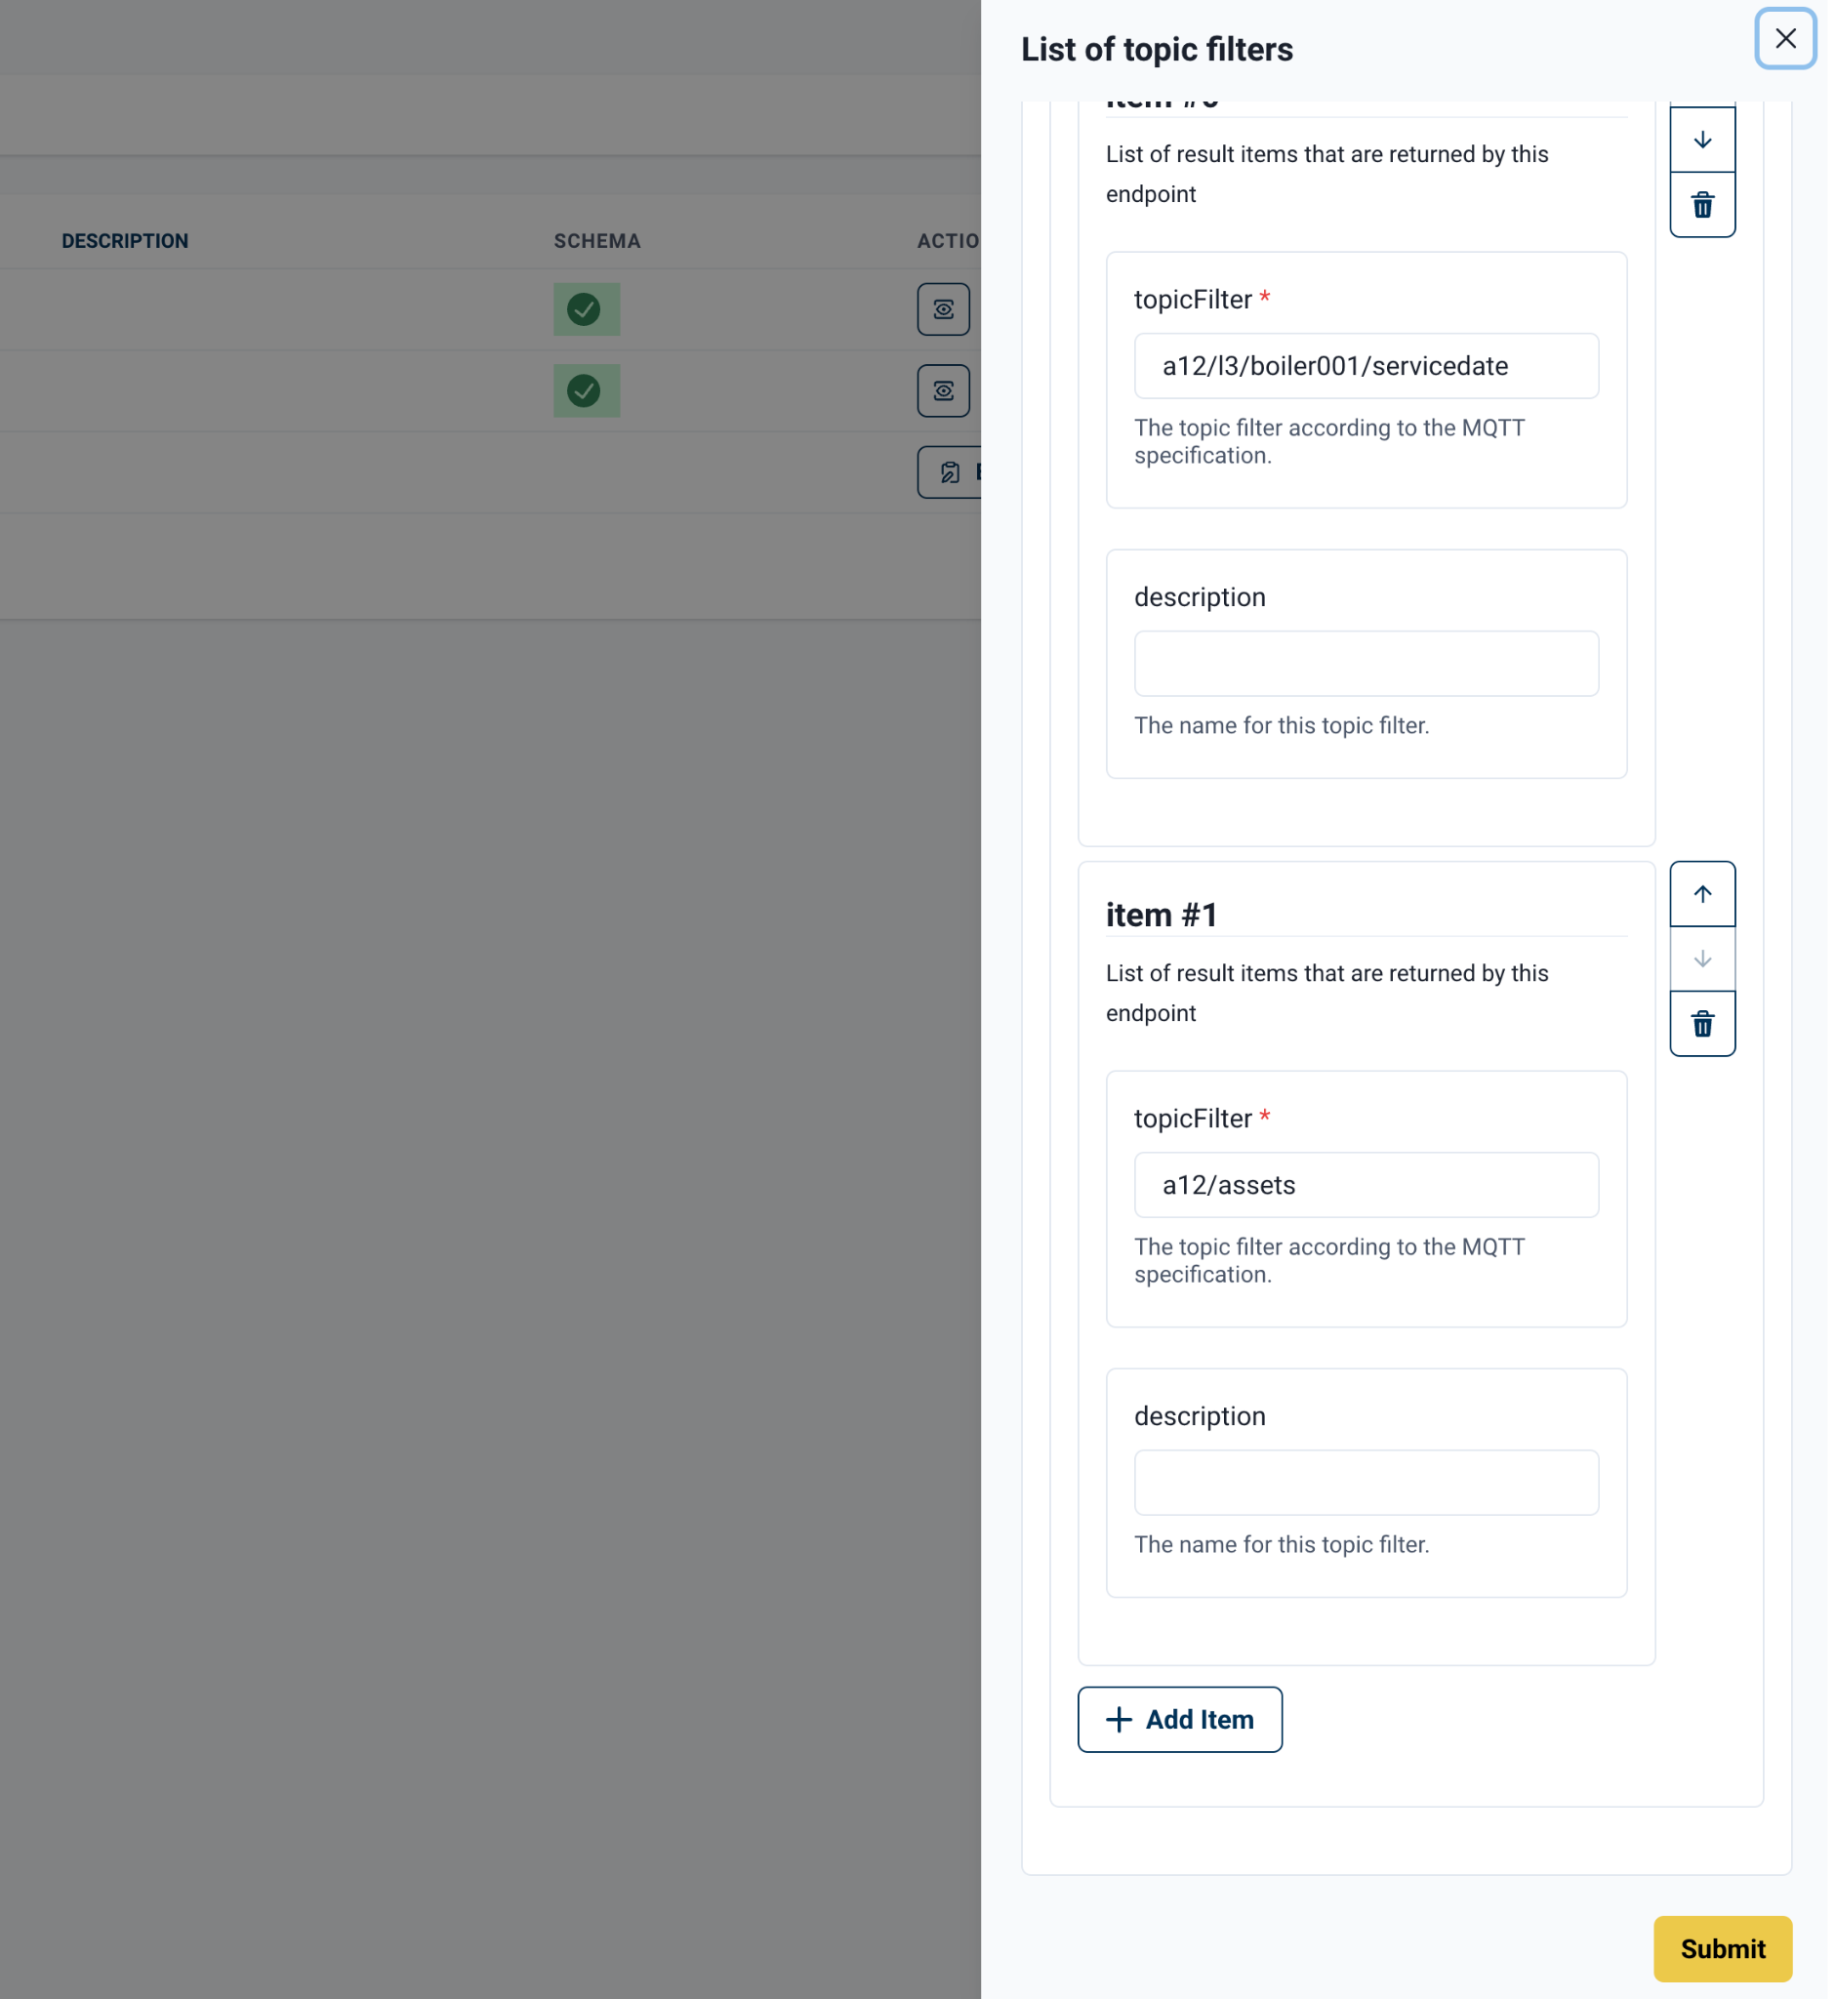
Enter a value in the topicFilter field and an optional description. To save your entries, click Submit.
The topicFilter value must exactly match an existing topic in your Edge Broker for the schema inference option to work.
For topics that have not yet been published, you must provide a schema manually.
|
In the Manage topic filters window, select the eye icon on the line item to open a schema panel with the following options:
-
Current Schema: Displays the current schema with a sample of the data.
-
Infer a schema: Generates a schema based on published data for the topic filter.
-
Upload a new schema: Uploads a custom schema for the topic filter.
| Manually assigned schemas must use JSON Schema format. |
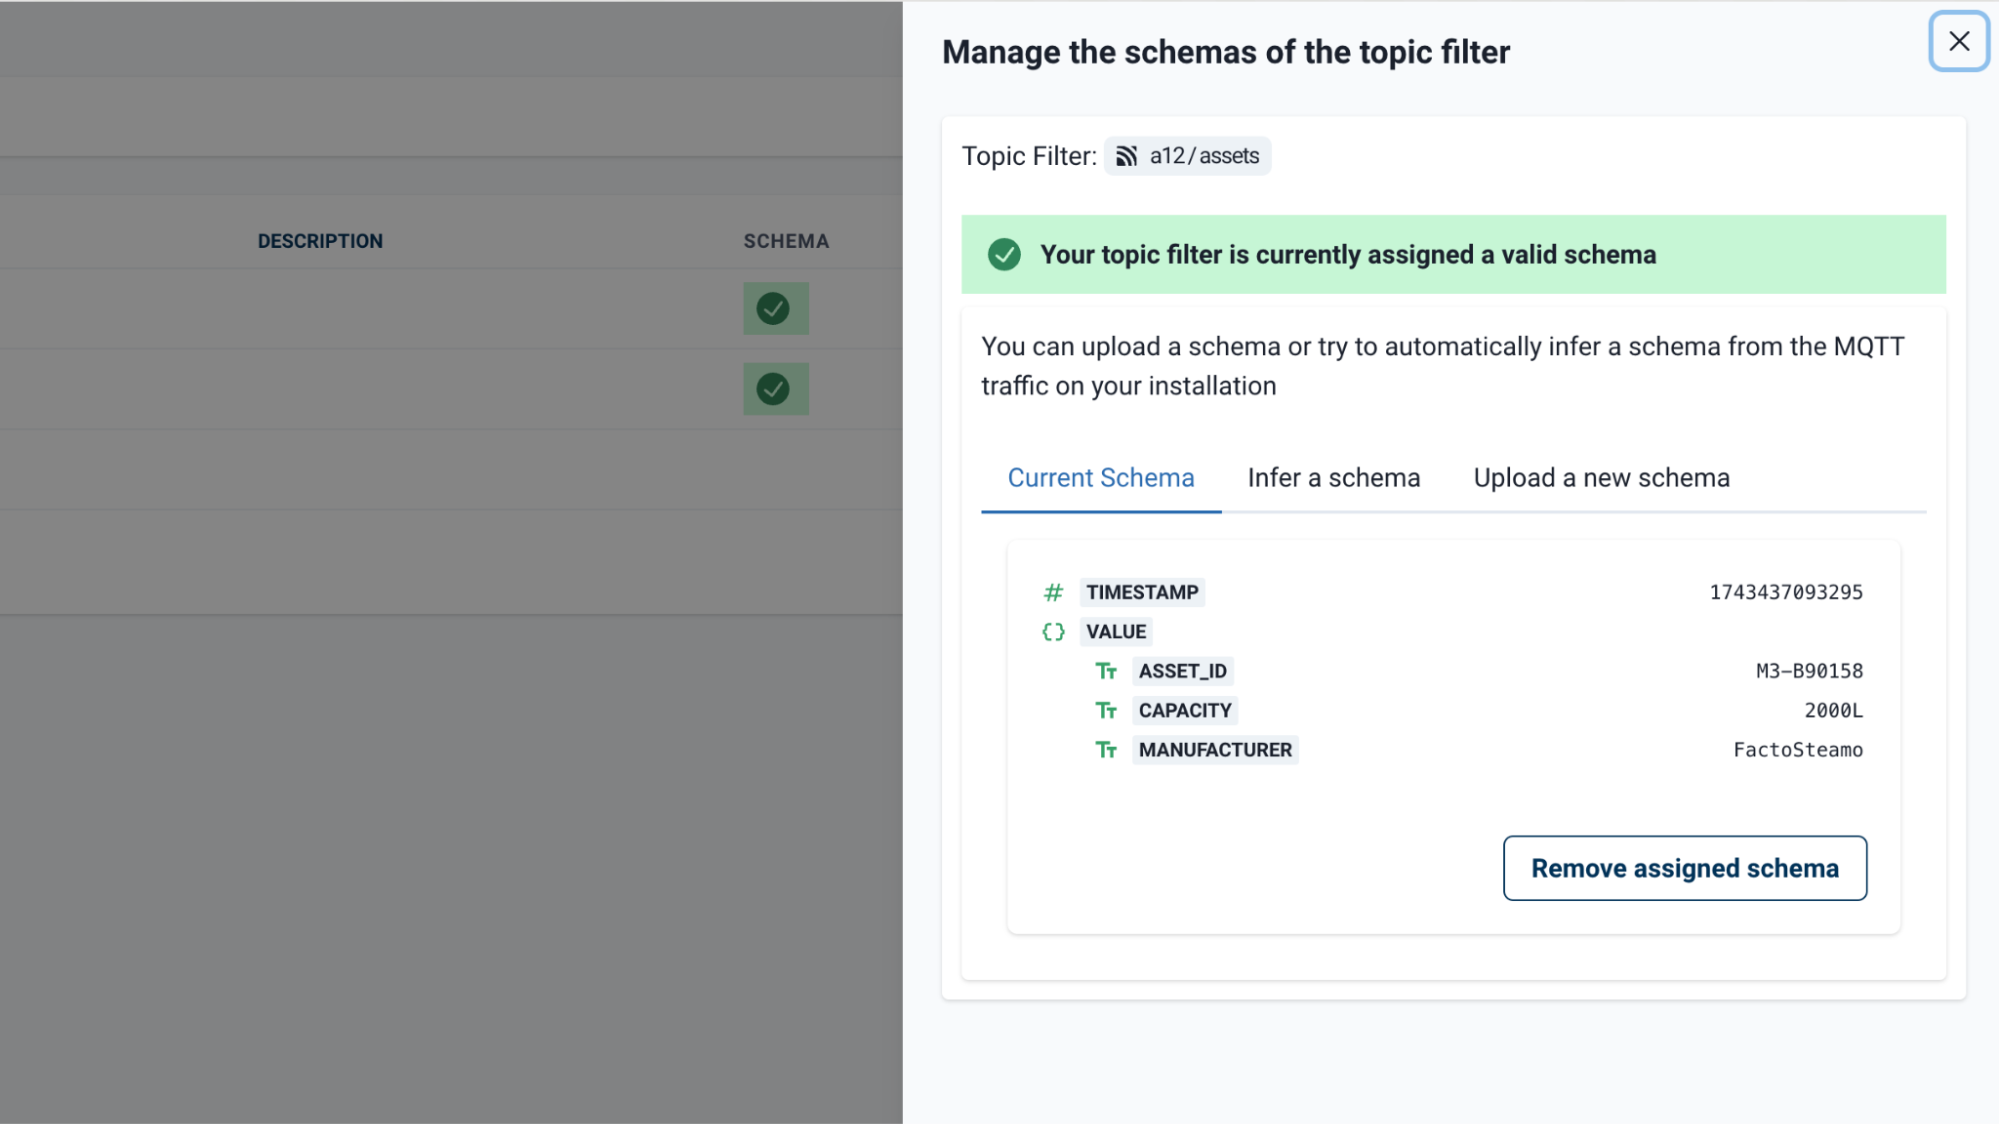
After you infer or upload a schema, a confirmation notification informs you that a valid schema is present for the topic filter.
Broker Node Overview Panel
To open the Edge Broker node Overview Panel, select the sidebar icon on the node overlay toolbar. This action activates a panel from the right-hand side that provides additional views.

The initial view is an interactive graph that shows all configured connections to Edge broker. Additional interactive views of configured tags, topics, and devices are available within the panel. The configuration button enables grouping of connections on the 'Workspace Cluster' view.
Bridge Nodes
Bridge Nodes are composed of two separate elements on the Workspace:
-
Bridge Configuration node
-
Bridge Destination node.
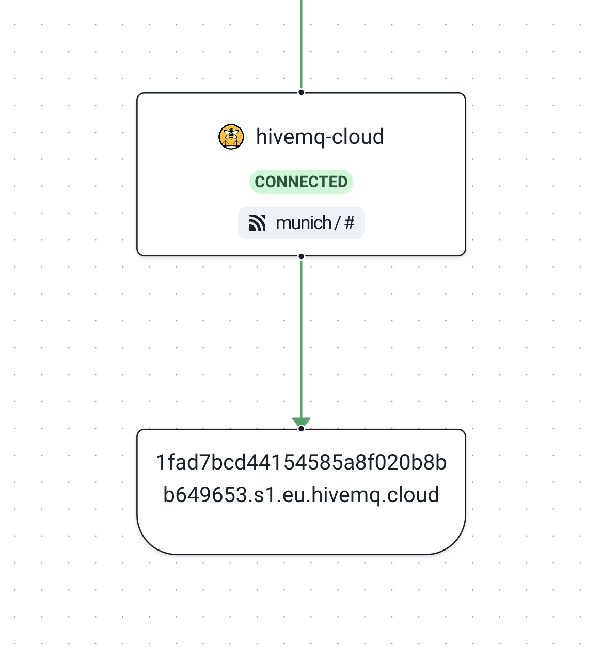
The Bridge Configuration node displays the user-configured name, connection status, and any configured topic filters. A + symbol denotes additional topic filters not in view on the node. The Bridge Destination node provides information on the endpoint to which the Bridge is connected (in the example above, HiveMQ Cloud).
| The Bridge Destination node is currently a placeholder, without any active features. |
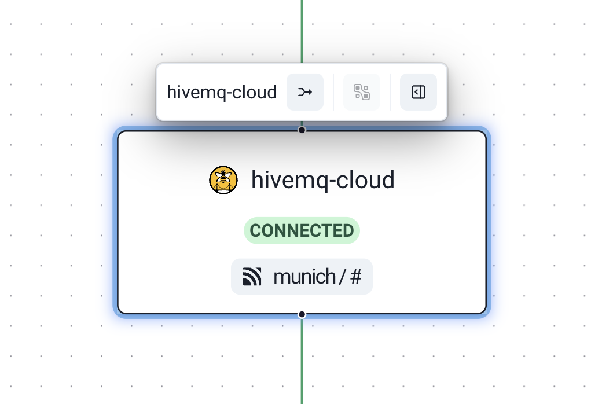
When you select the Bridge Configuration node, an overlay toolbar opens with the following available options:
-
Create a data combiner from selection (arrows join icon): Create a data combiner using the currently selected bridge topic filters.
-
Open the overview panel (sidebar icon): Open the Bridge Configuration Overview Panel from the right side of the screen.
Bridge Configuration Node Overview Panel
To access the Edge Bridge Configuration node overview, select the sidebar icon on the node overlay toolbar for the bridge. This action opens a panel from the right side of the canvas that provides additional details and contextual views for the selected bridge.

The panel provides a configurable metrics view that allows you to select and display additional metrics in the same way the Observability Panels function. The panel also provides the five most recent events for the Bridge, sourced directly from the Event Log. Options to modify, stop, and restart the Bridge are located at the bottom of the panel. These controls are identical to the management options available in the MQTT Bridges list in the main menu.
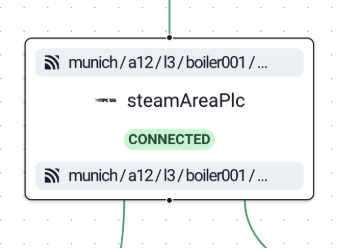
Protocol Nodes
Protocol Adapter nodes on the canvas are always connected to a Device node. Together, the nodes represent a configured Protocol Adapter in Edge and serve as the entry point for managing adapter configuration, mapped tags, and northbound/southbound MQTT topic mappings. When you create a Protocol Adapter in Edge, these nodes become interactable elements on the canvas.

Device Node
The Device node represents the device or endpoint that the Protocol Adapter is connected to. If you have already configured tags for the device, the node lists them. A + symbol indicates that more tags are available than those on view. Icons on the Device node indicate the capabilities that the device-adapter setup supports:
| Icon | Capability |
|---|---|
Joining arrow |
Data combining |
Outbound arrow |
Northbound mappings |
Inbound arrow |
Southbound mappings |
Compass |
Data discoverability |

When you select a Device node on the canvas, the Edit device tags (tag icon) option becomes available in the overlay toolbar. Select this option to open a panel on the right of the canvas to manage device tags.
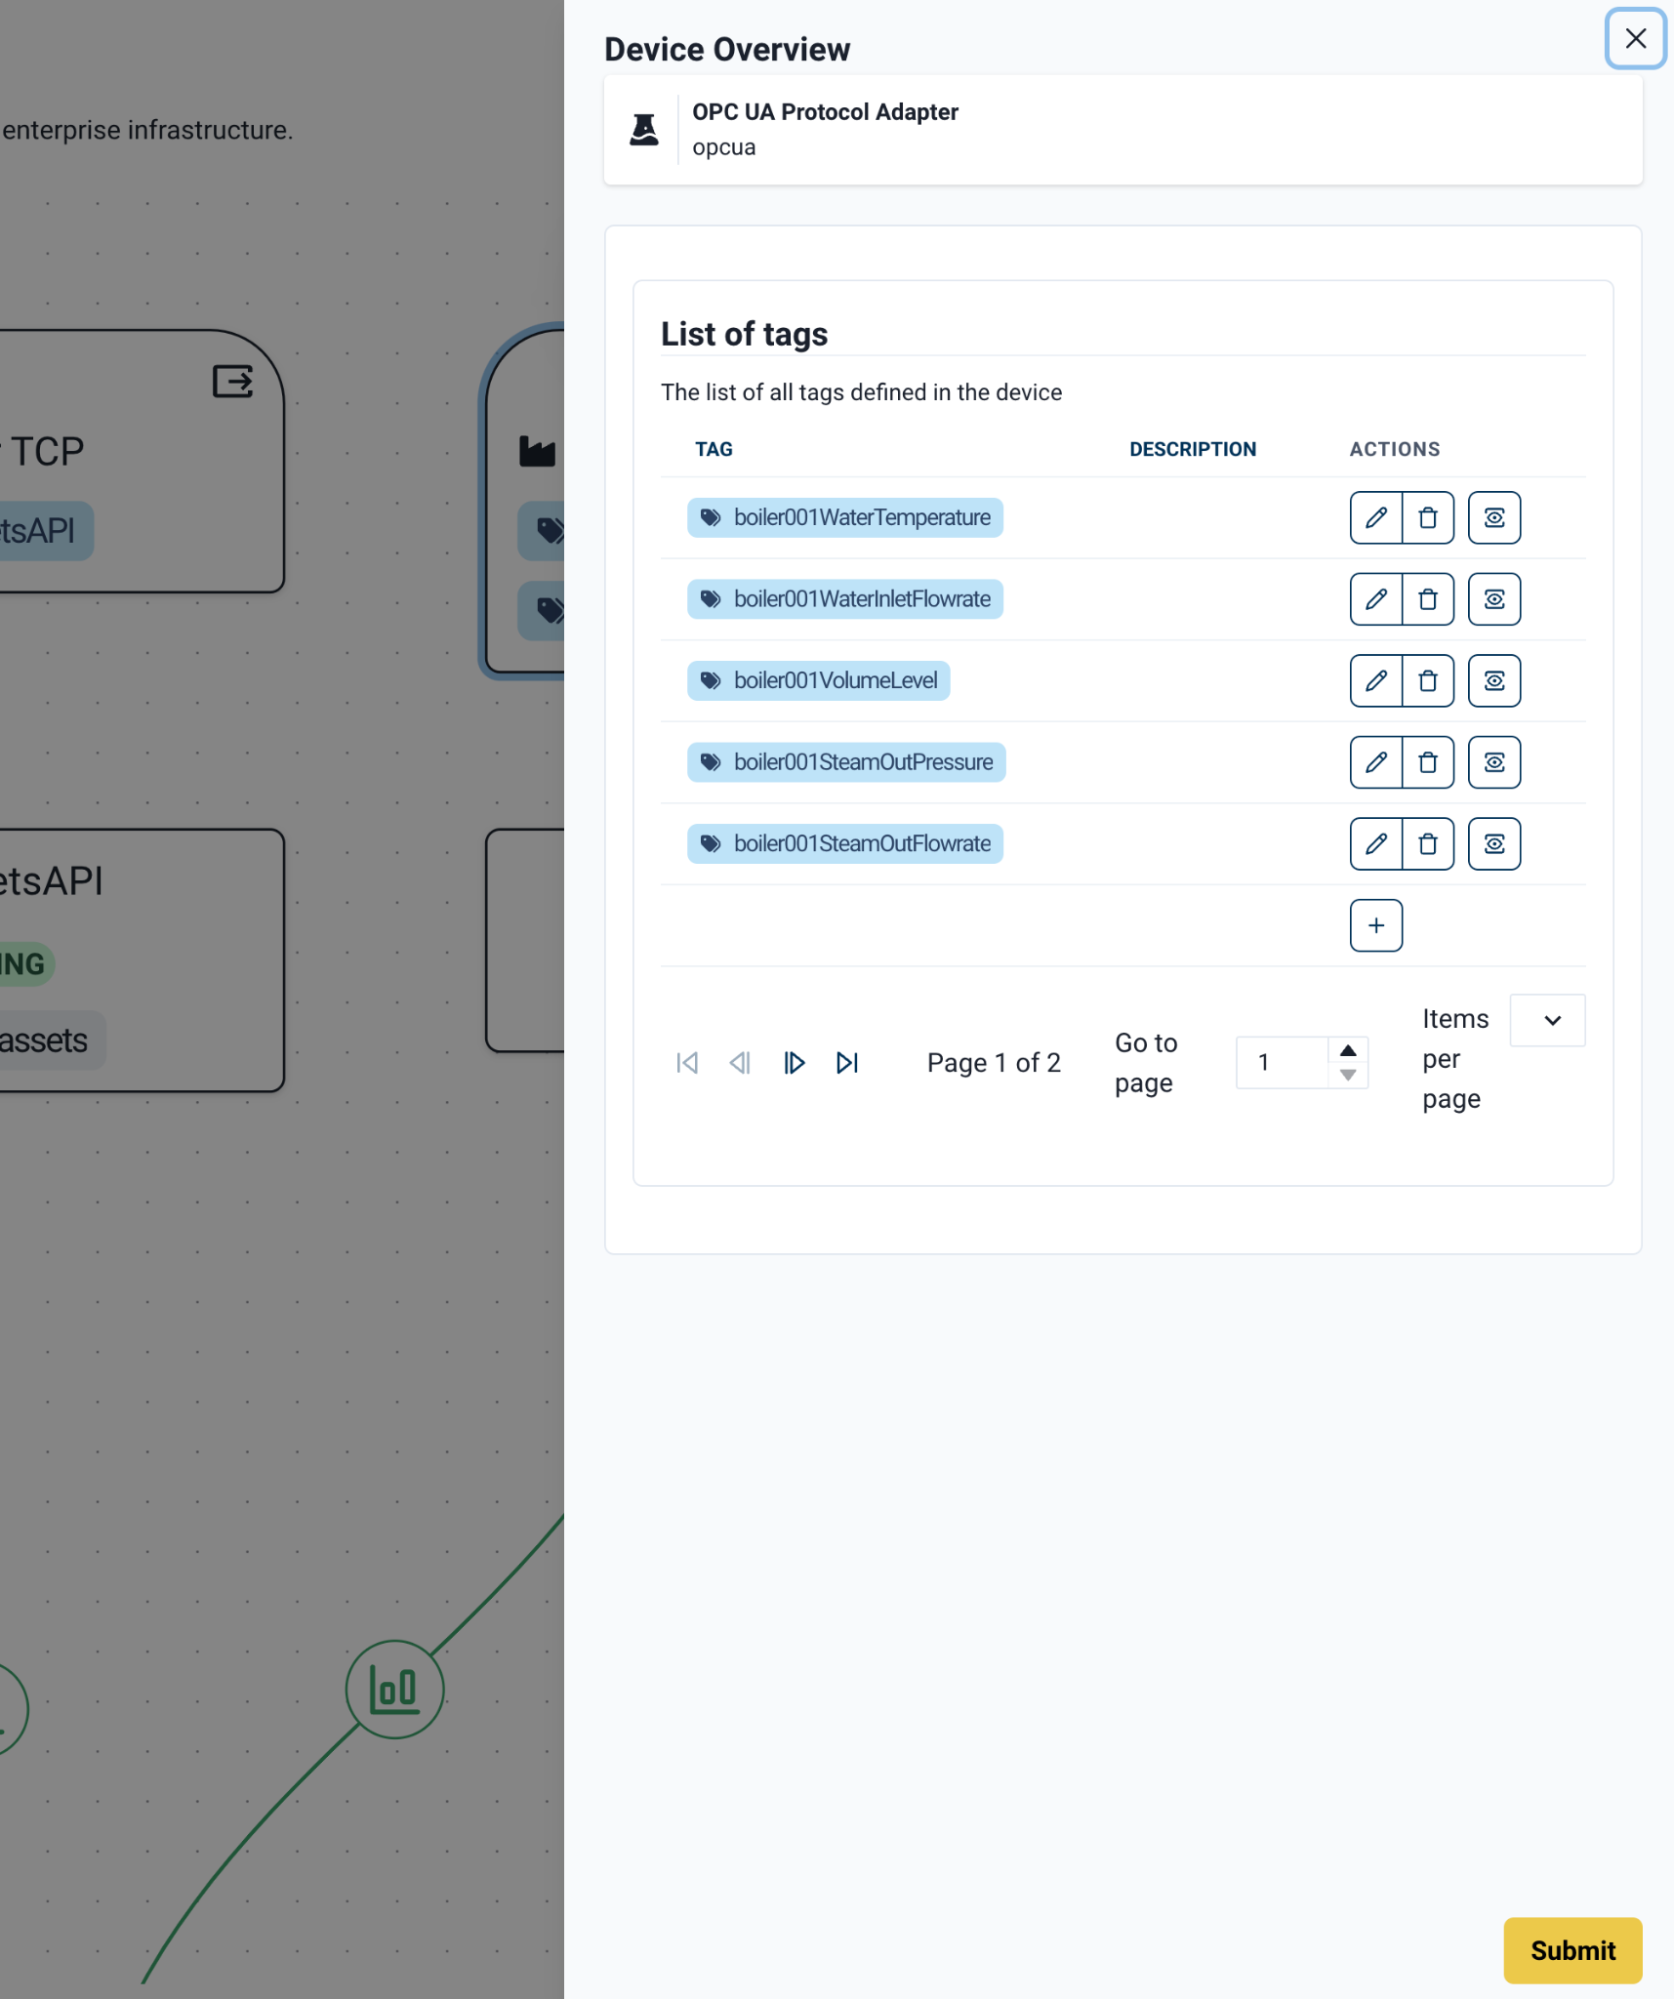
The Device overview panel displays a paginated list of pre-populated tags. Use the tag count selector to adjust how many tags are visible at once. To add a tag, select the + symbol.
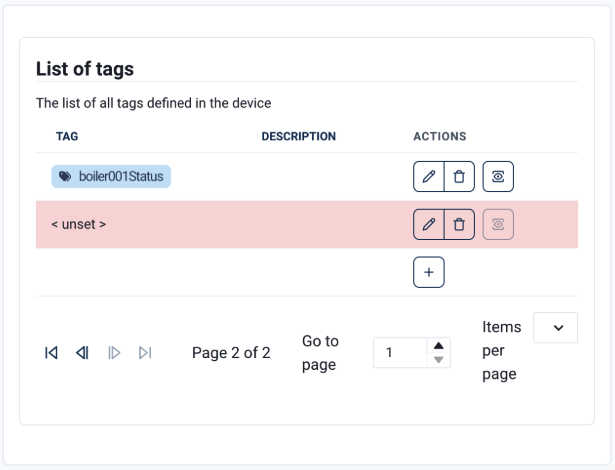
Adding a new tag creates an < unset > placeholder in the list.
Select the pencil icon to edit the tag. Select the bin icon to delete it.
To save your tag mappings and return to the Workspace canvas, select Submit.
| Tag fields vary by protocol. For example, OPC-UA requires a Node ID, while S7 requires a Tag Address. |
Adapter Node
The Adapter node represents a configured HiveMQ Edge Protocol Adapter and is where you manage MQTT mappings. The node displays all mapped topics. A + symbol indicates more mappings are available than those on view.
When you select an Adapter node, an overlay toolbar with the following options opens:
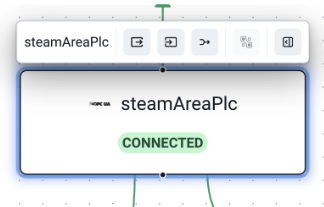
The following toolbar options are available:
-
Box with outbound arrow: Edit Northbound mappings. Map device tags to MQTT topics.
-
Box with inbound arrow: Edit Southbound mappings. Maps MQTT topic filters back to OT data sources.
-
Joining arrows: Create a data combiner from the selection. Combines tags and topic filters.
-
Sidebar icon: Open the overview panel. Opens the Overview Panel from the right side of the canvas.
Northbound mappings send device tag data to MQTT topics. To get started, select Edit Northbound mappings from the Adapter node overlay toolbar to open a new window.
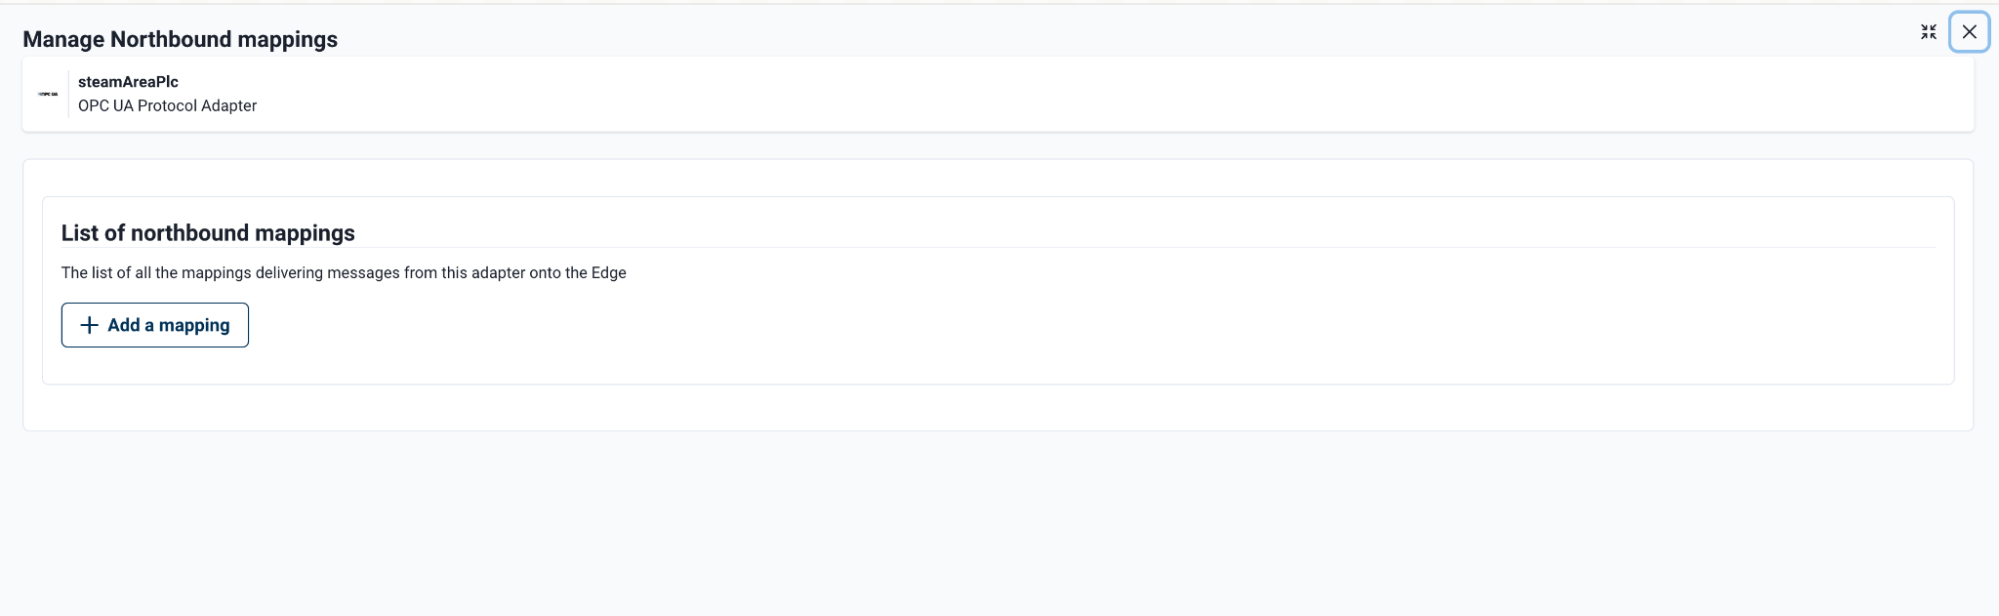
The Manage Northbound mappings window lists all northbound mappings that are currently available. To create a new entry, select + Add a mapping.

When you add a new mapping, two fields are mandatory:
-
Source Tag Name: Select a tag from the dropdown. This list is populated from the tags mapped to the associated device.
-
Destination Topic: Enter the MQTT topic to which tag data is published.
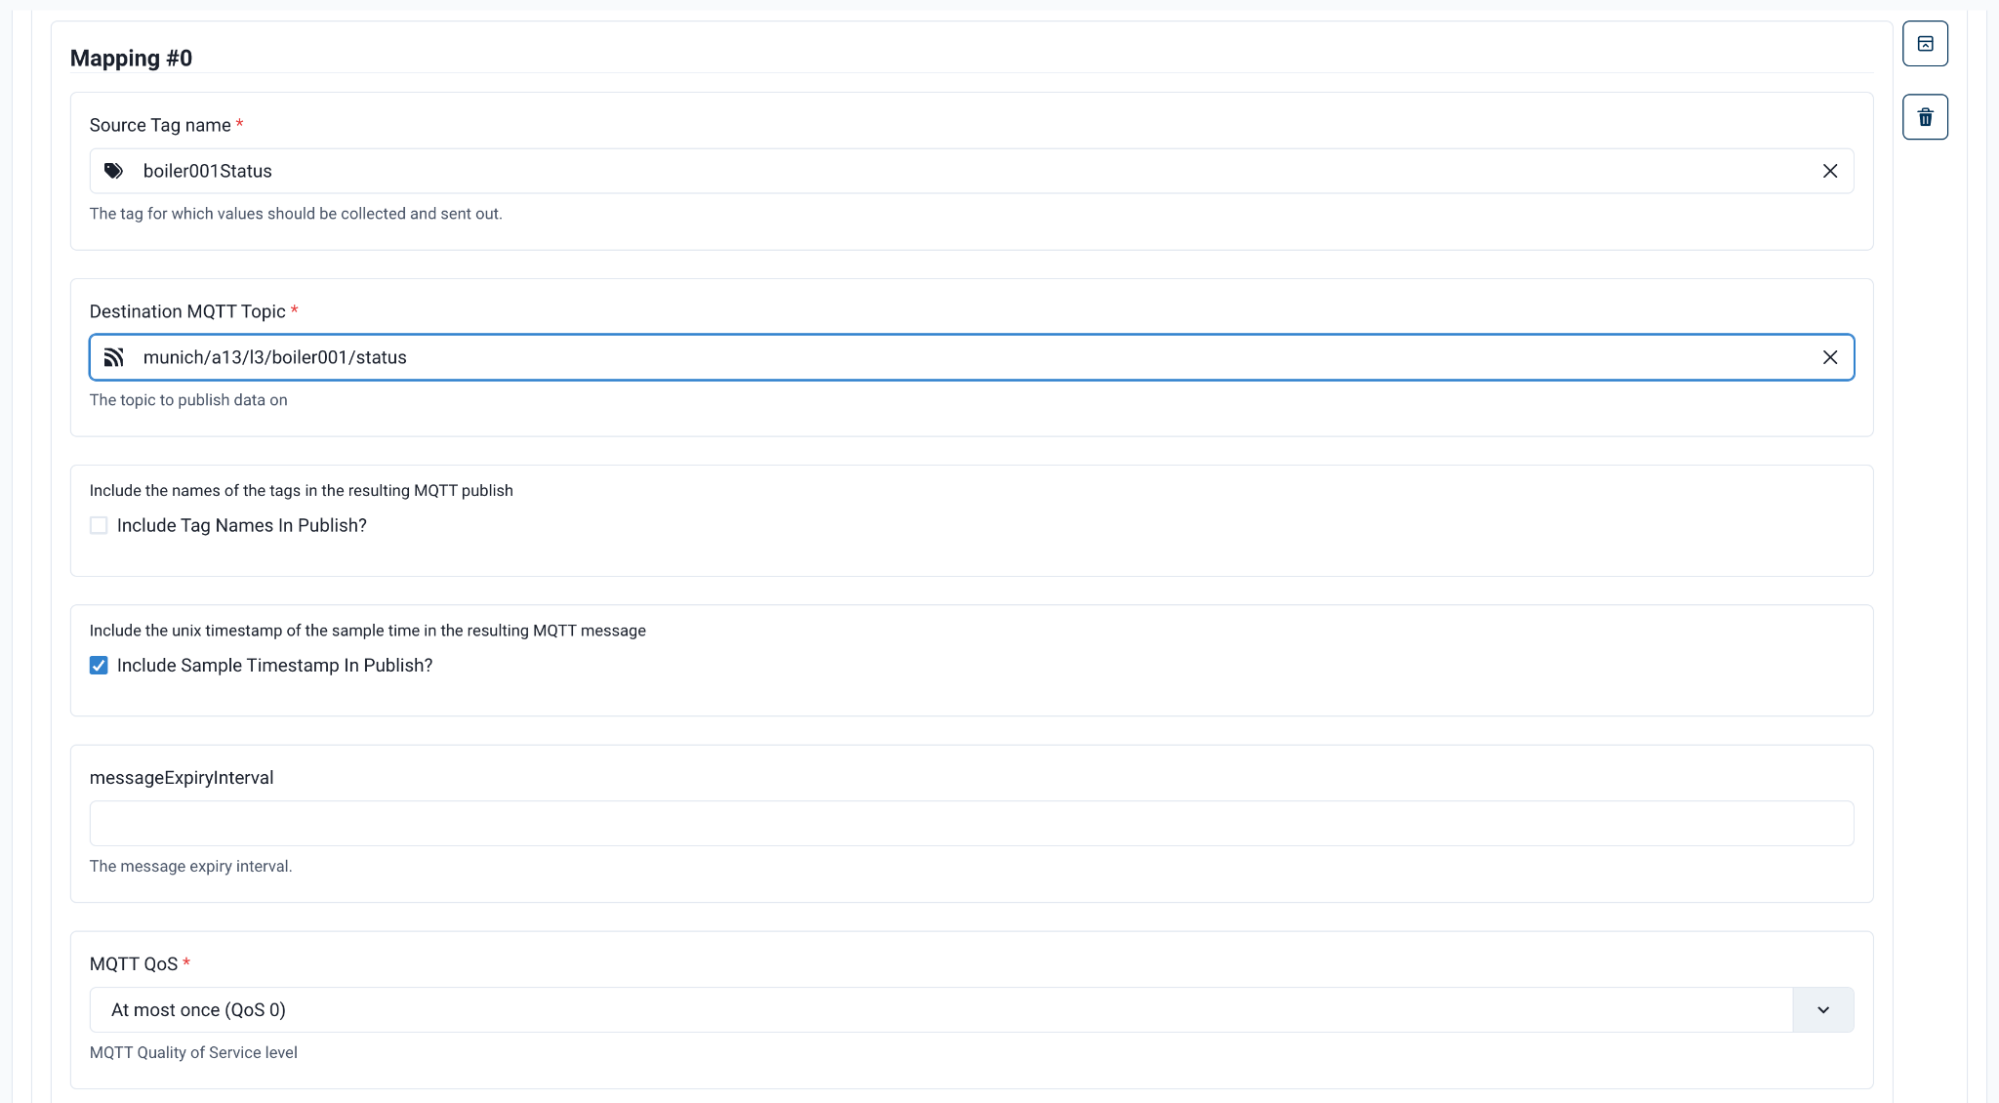
| Destination Topics can be created on the fly in the editor. However, before you configure a northbound mapping, you must create all tags required for the northbound mapping in the corresponding device. |
After you define the source tag and destination topic, additional options are available:
| Option | Description |
|---|---|
Include Tag Names in Publish |
Adds the source tag label to the MQTT payload. |
Include Sample Timestamp in Publish |
Adds the timestamp when HiveMQ Edge captured the data to the MQTT payload. |
Message Expiry Interval |
Sets the MQTT message expiry interval. If you leave this field empty, HiveMQ Edge uses the default message expiry interval. |
MQTT QoS |
Sets the QoS level for the selected mapping. This field is mandatory. QoS 0 is the default. |
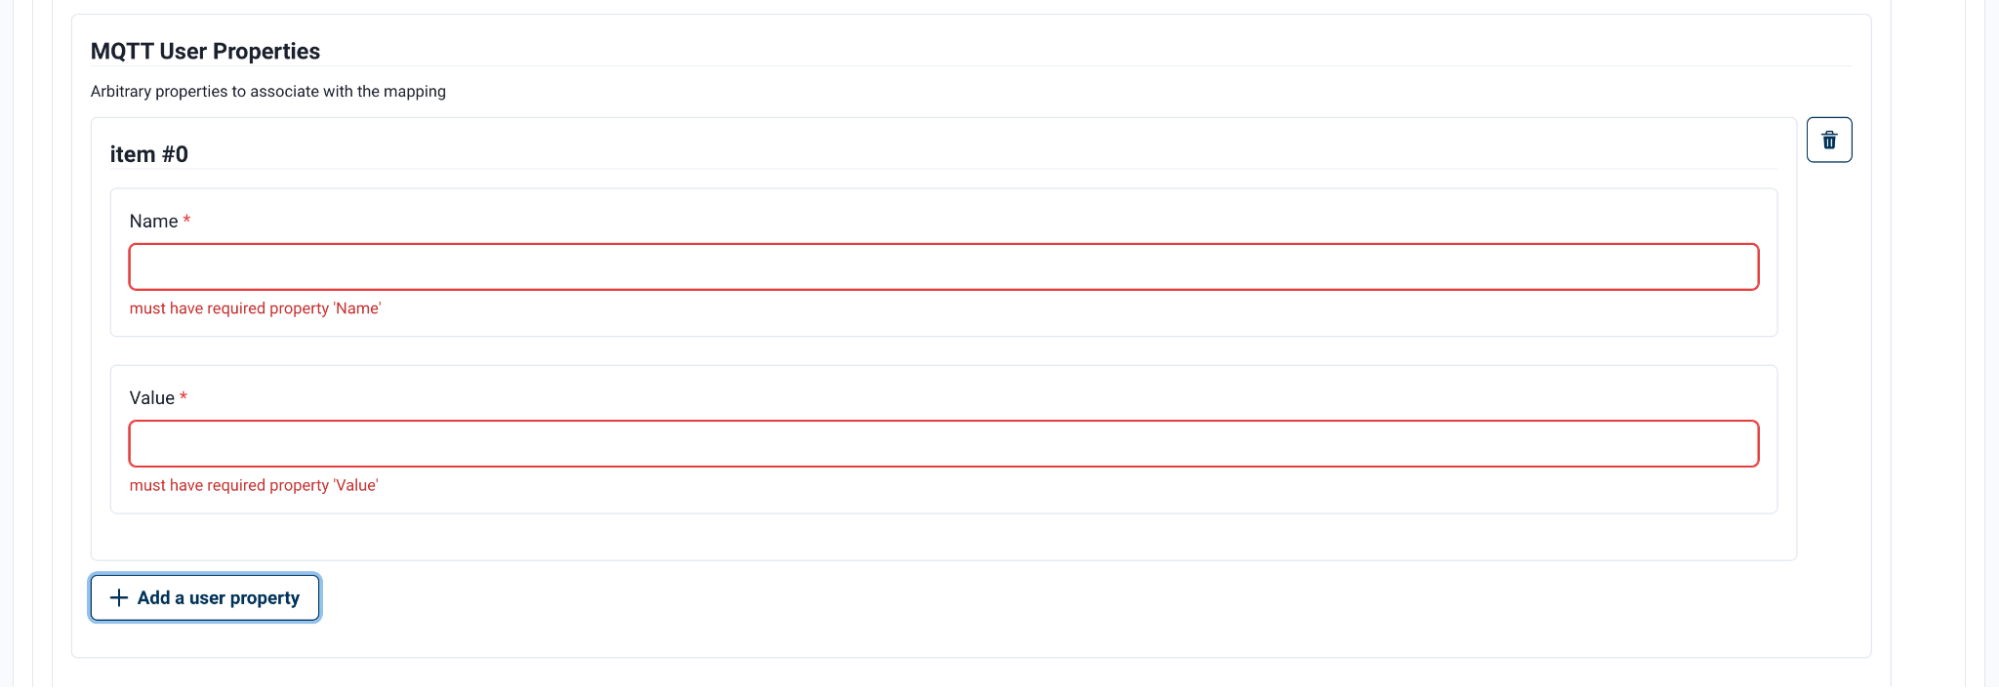
To view additional options, select + Add an MQTT User Property. A view opens to provide two custom user property fields. HiveMQ Edge publishes these fields as static data into the topic payload every time HiveMQ Edge samples the device tag. To add additional properties, select + Add a user property.
To continue mapping additional tags to topics, select the + Add a mapping at the bottom of the MQTT mapping panel. To save your mappings and return to the list of mapped topics, click Submit.
Southbound Tag Mappings
To map MQTT data to tags, select Edit Southbound mappings from the Adapter node overlay toolbar.
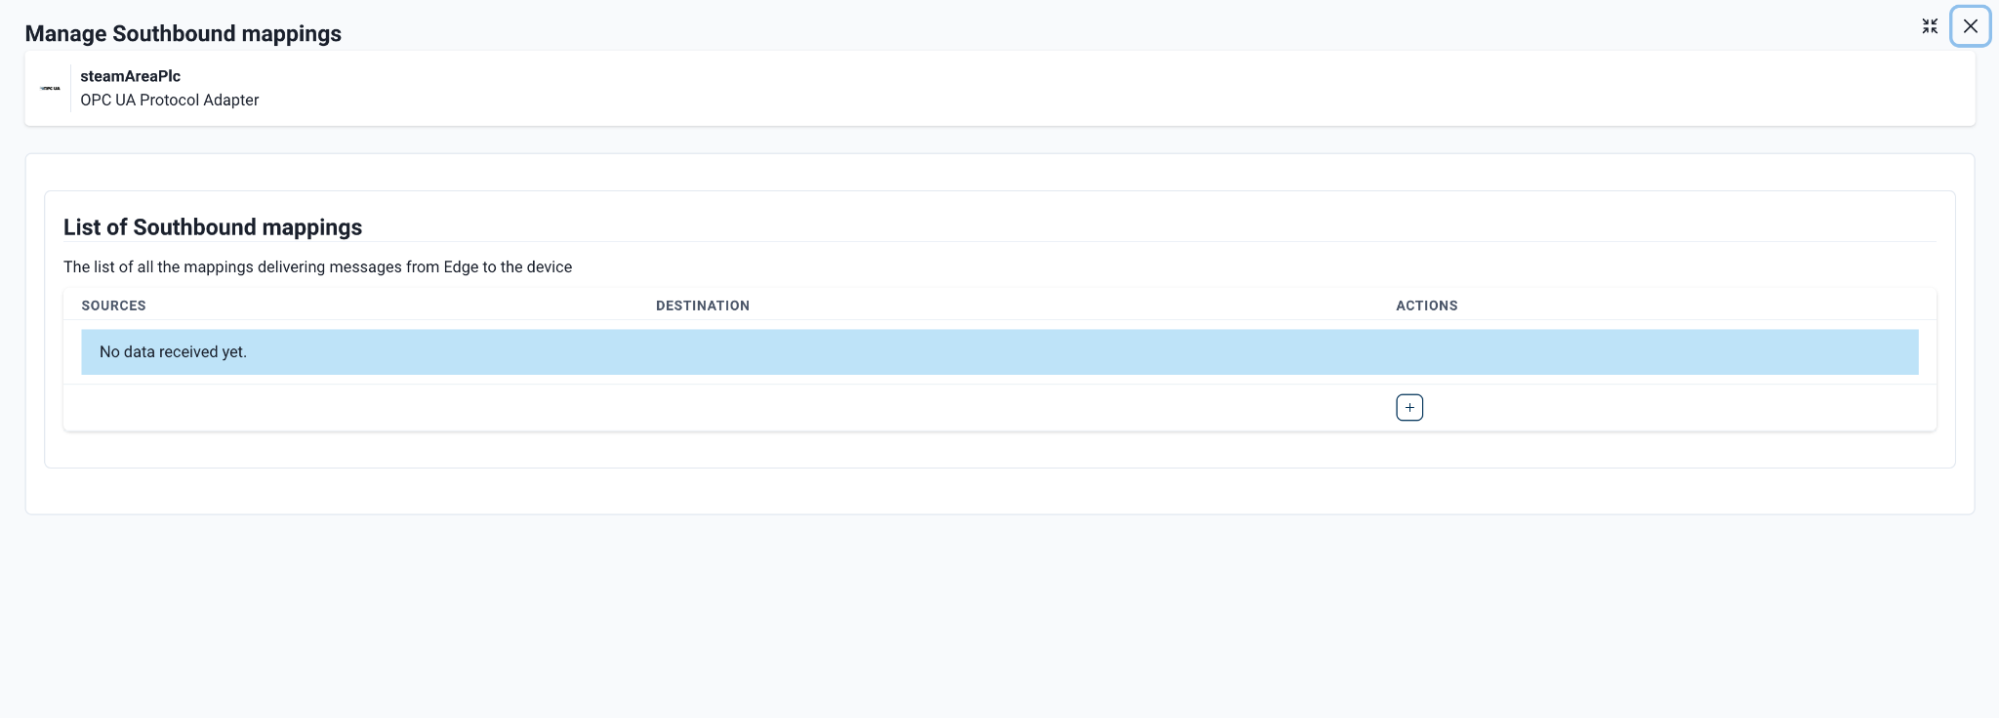
A list of southbound mappings opens. To add a new mapping, select the + symbol at the bottom of the list.
Select the pencil icon on the < unset > mapping you created.
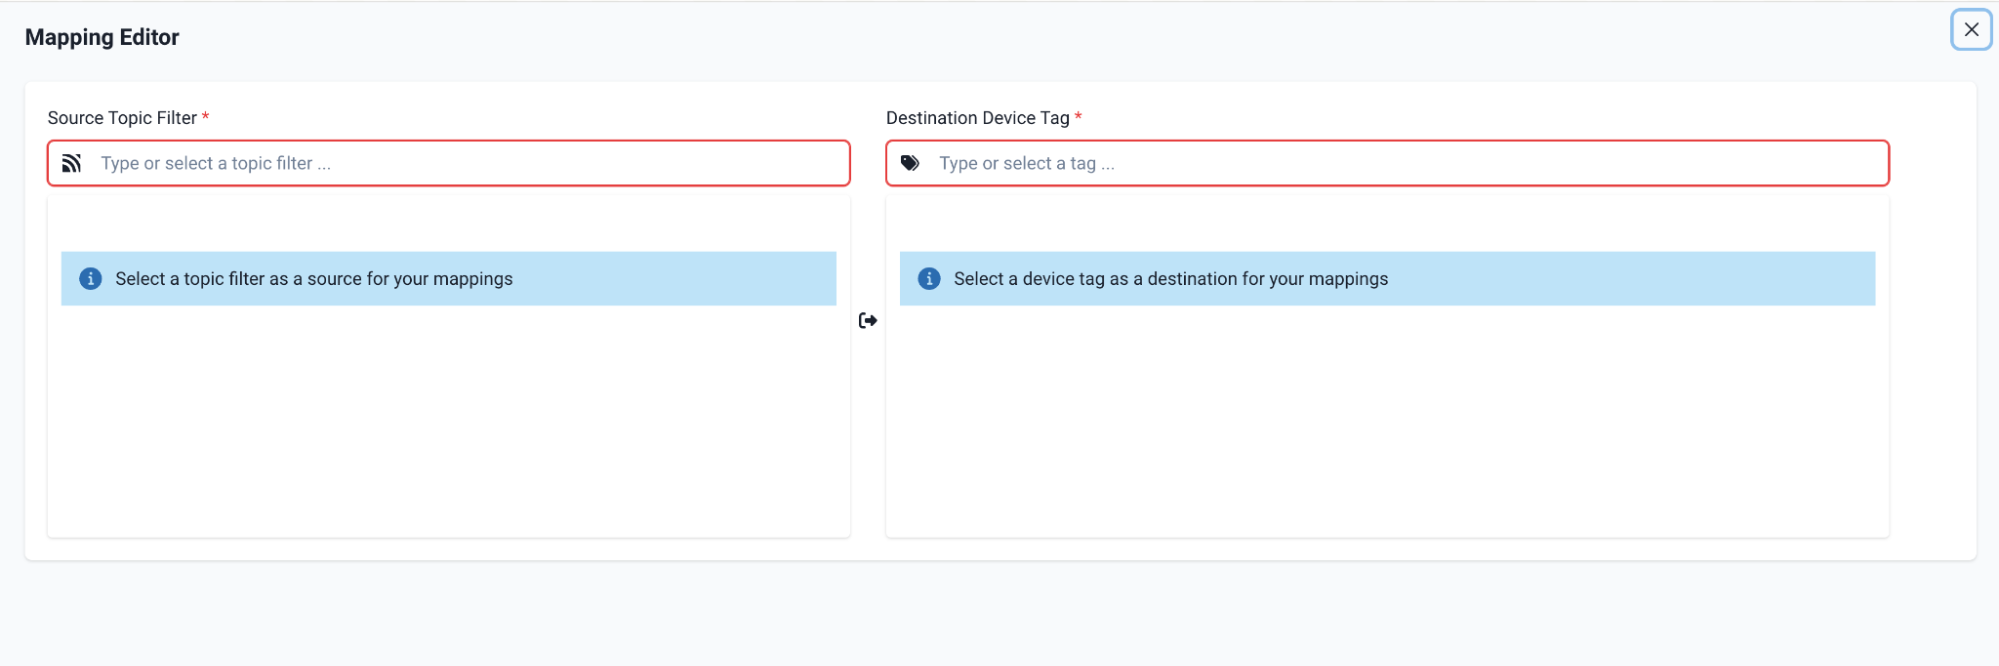
This opens the Mapping Editor for the <unset> Southbound Mapping.
Select the Source Topic Filter and Destination Device Tag fields to view a list of available topic filters for mapping and a list of the tags available for the current device connected to the Protocol Adapter.
| Both the topic filter and the tag MUST exist before being selected in a southbound mapping: topic filters in the Edge node and tags in the relevant Device node. |
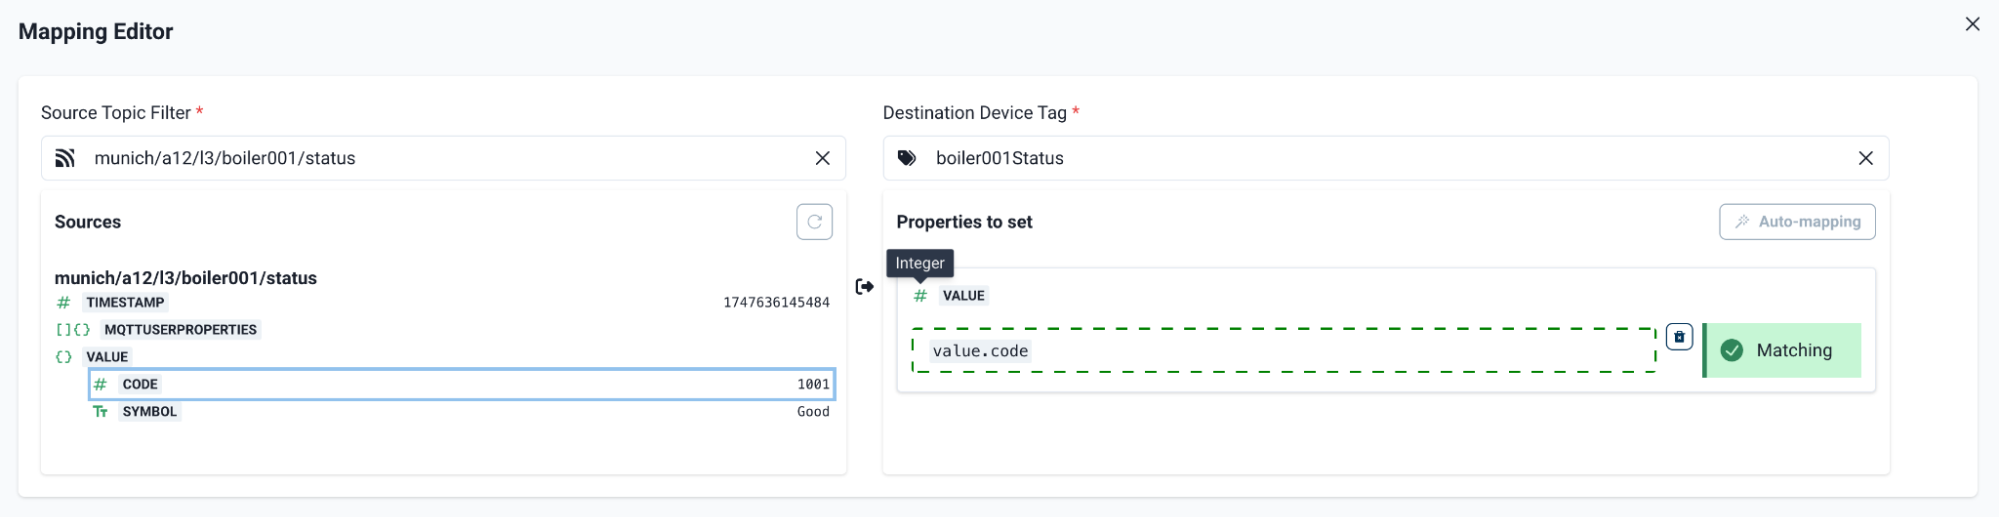
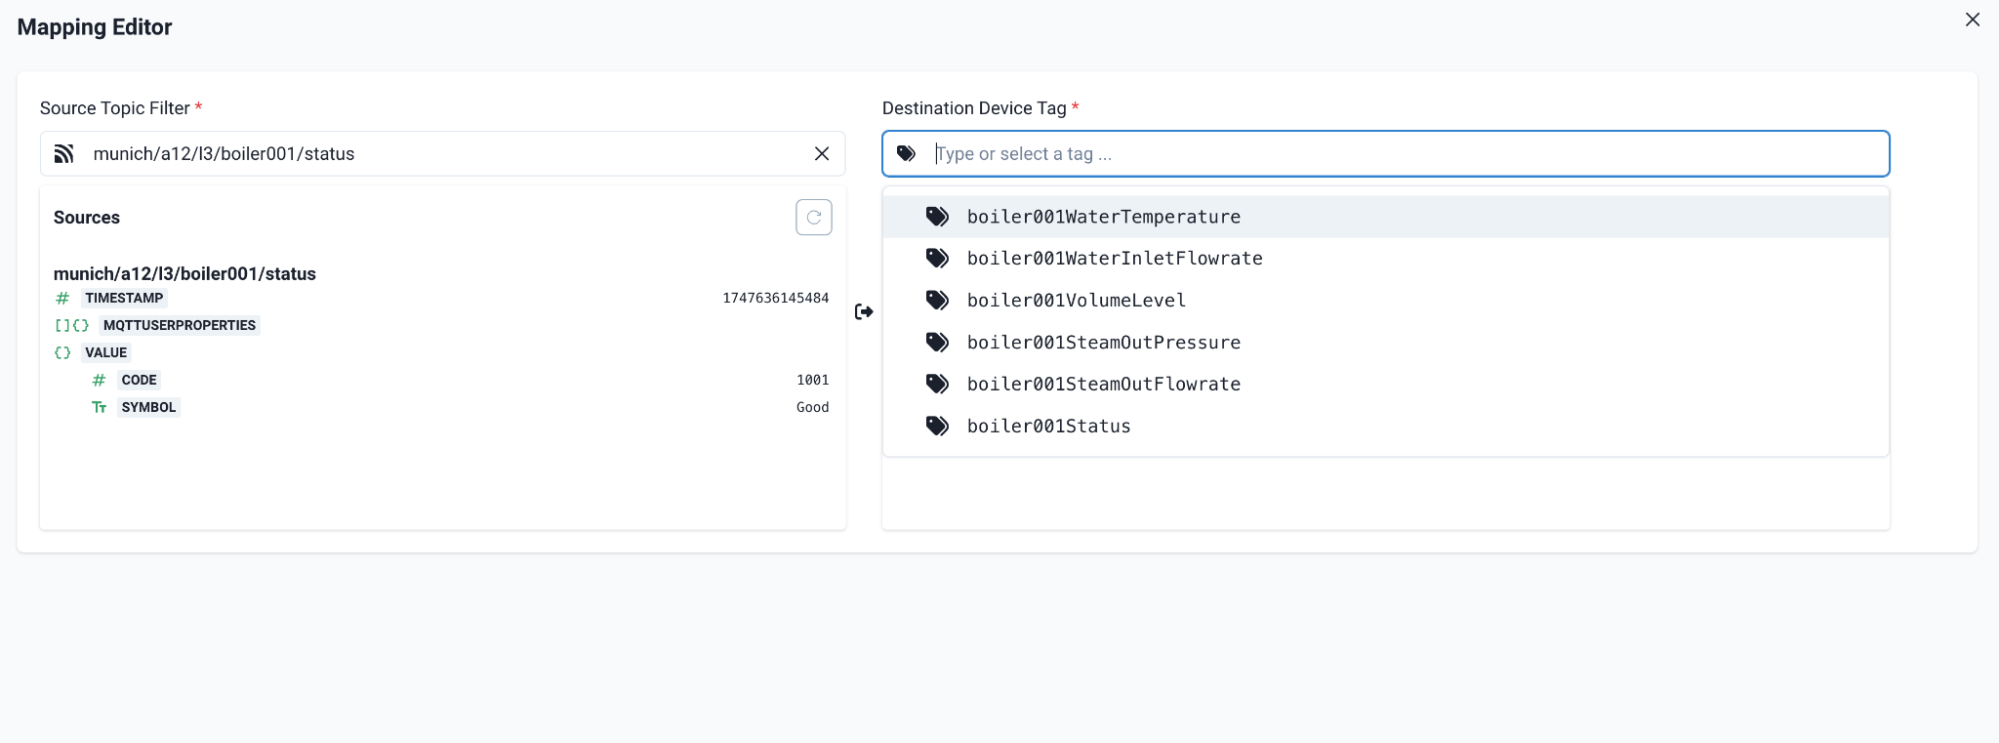
When you select a source, the interface provides the topic filter schema and a sample of the data being published. When you select a destination device tag, the interface provides the expected schema to be written to. Map the attributes with a drag-and-drop motion from the topic schema attributes to the tag schema attributes. A symbol labels the tag schema attributes to denote the expected data type. In the example above, the 'value' attribute field expects an integer. If you pull another data type such as string, the field remains unmatched and you cannot save the mapping. Use the 'Save' button in the bottom right of the view to commit the mapping.
| HiveMQ Edge verifies only that the data presented is of the expected data type based on the available OT schema. HiveMQ Edge does not validate the data sent to OT data sources to be the correct value. Users are strongly advised to test southbound mappings on non-operational setups before configuring southbound data flows on operational systems. |
Southbound mapped topics appear at the top of the Adapter node on the Workspace canvas once configured.
Adapter Node Overview Panel
To access the Adapter node overview, select the sidebar icon on the node overlay toolbar for the adapter. This option opens a panel from the right side of the screen that provides additional views.
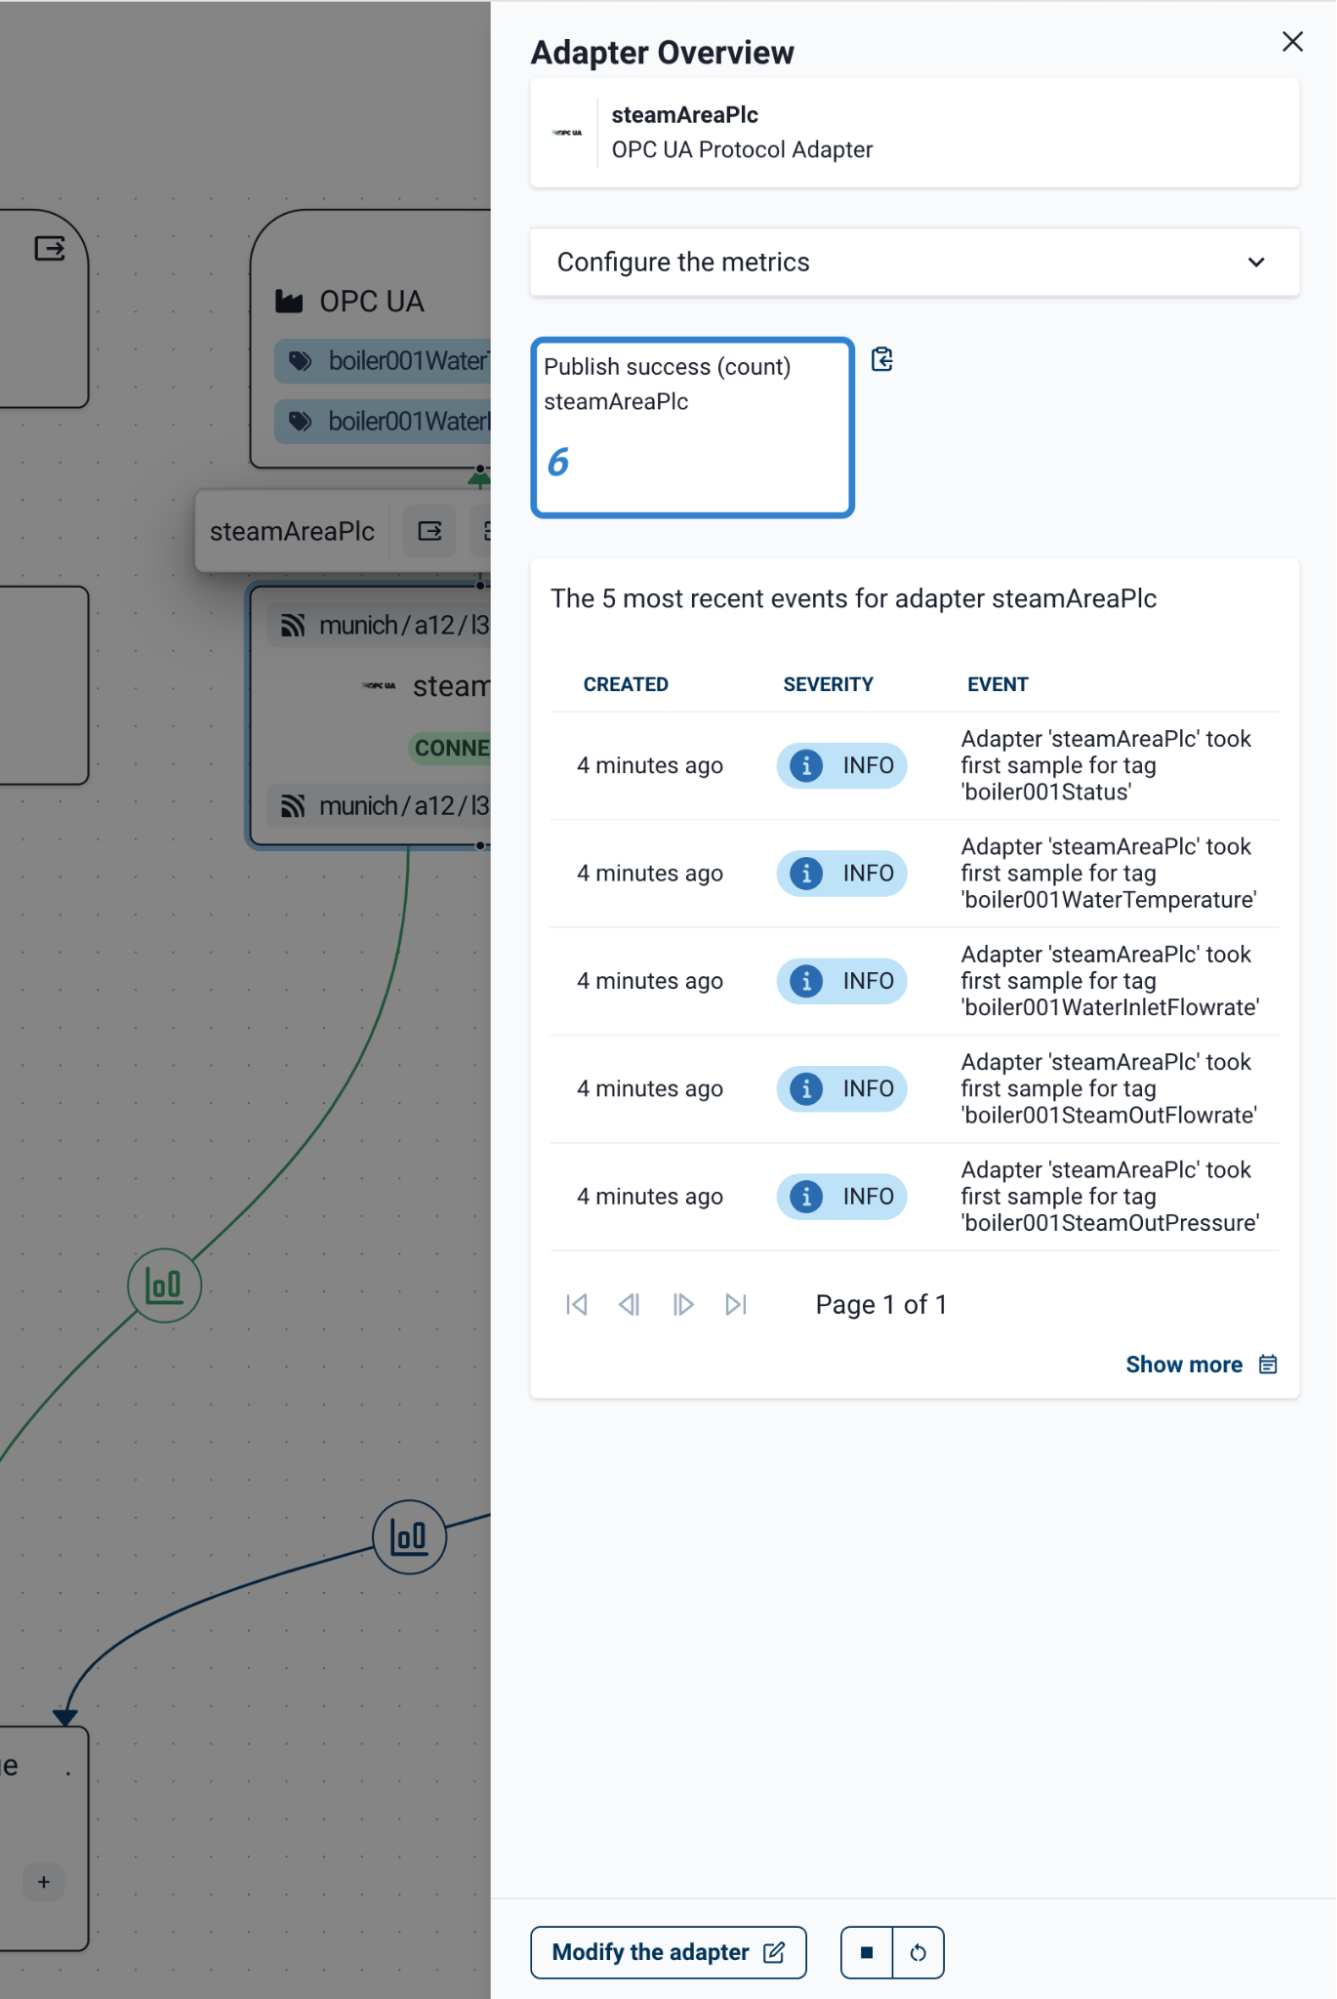
The panel provides a configurable metrics view where you can select additional metrics to display in the same way the Observability Panels function. The panel also provides the most recent five events for the adapter from the Event Log. Options to modify, stop. and restart the adapter are provided at the bottom of the panel.
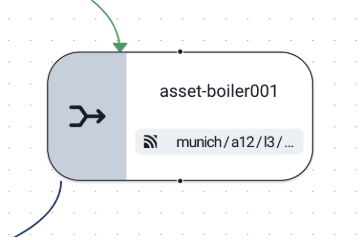
Combiner Node
On the Workspace canvas, Combiner nodes are identified by rounded corners and a joining arrows icon. Each node displays the combiner name and the destination MQTT topics to which combined messages are published. A + symbol indicates additional destination topics beyond those visible.
Data Combinations
To create a data combination on the Workspace canvas, select Adapter nodes and use the Create a data combination from selection option from the overlay toolbar.
| To support the use of MQTT topic filters in combinations, the Broker node is selected as a source by default. |

When you create a Combiner node, a node overlay toolbar on which only the Open the overview panel (sidebar icon) is available. Select the sidebar icon to open the Overview Panel on the right side of the screen.
Combiner Node Overview Panel
The overview panel contains three sections: Configuration, Sources, and Mappings.
Configuration
-
Unique ID: The unique automatically generated identifier of the node. This identifier cannot be edited.
-
Name: The user-defined name for the combiner. If no name is set, defaults to
unnamed combiner. -
Description: The user-defined description of the combination.
Sources
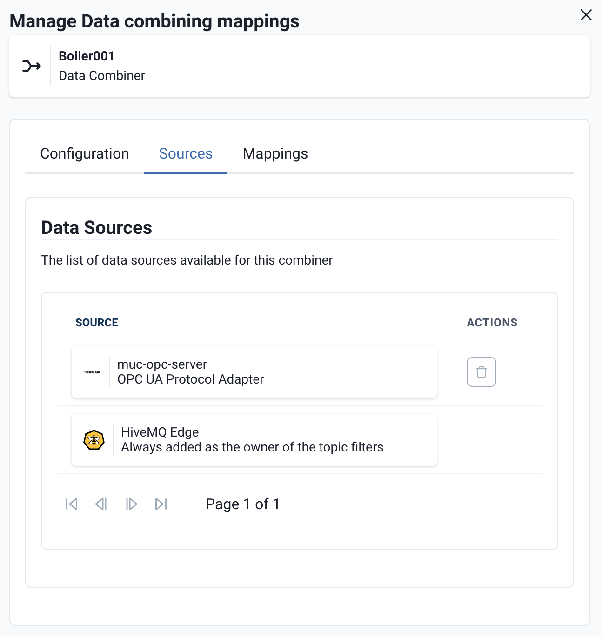
A paginated list of the data sources selected from the Workspace canvas. The Broker node is always included by default. Each source except the Broker can be deleted using the trash icon.
Mappings
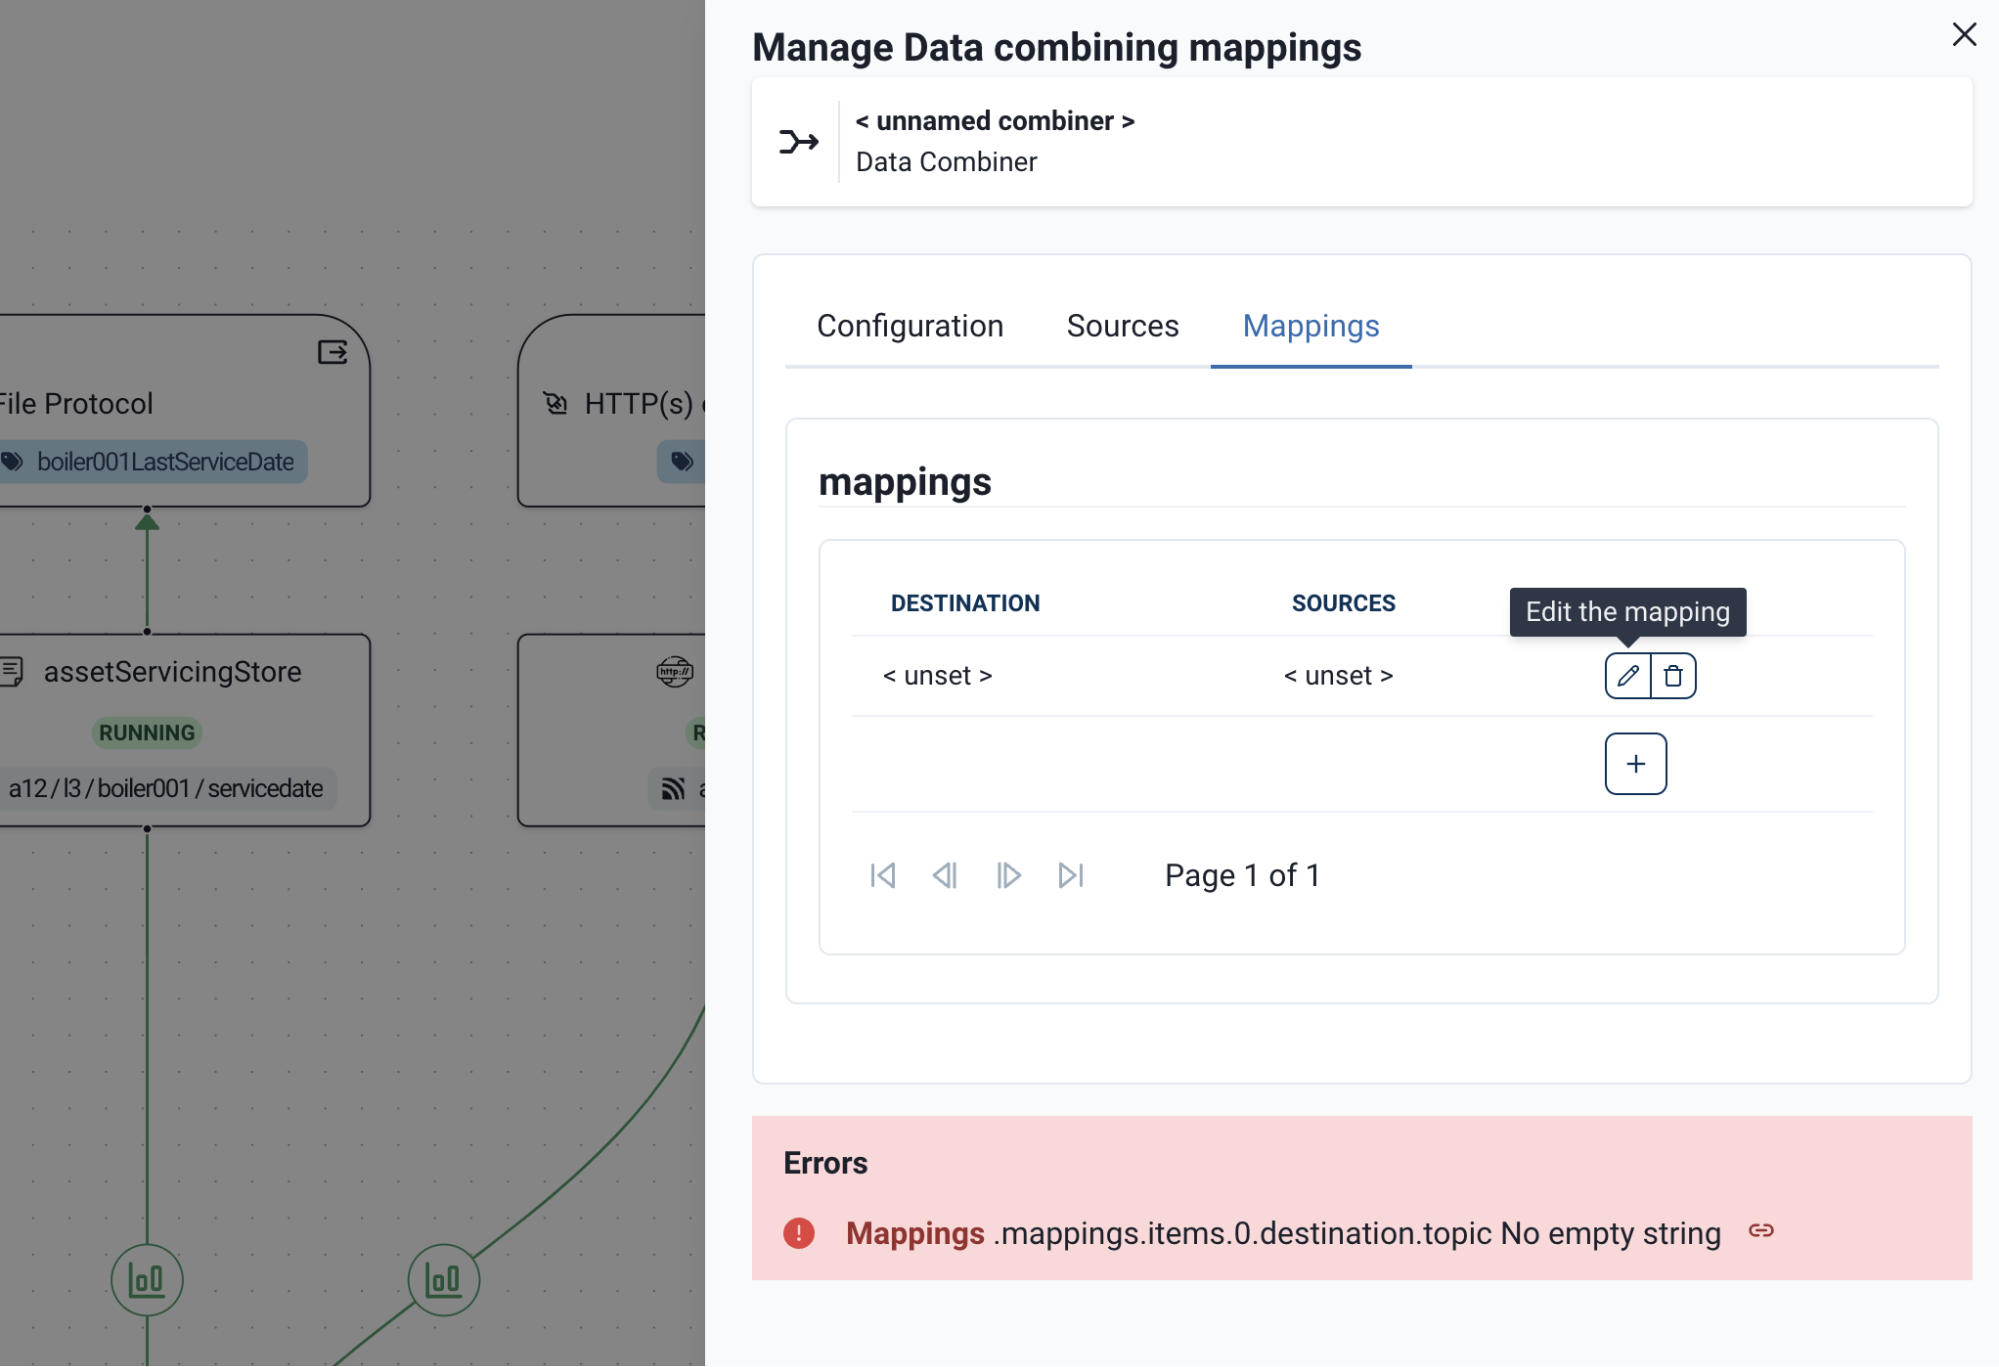
A paginated list of mappings for the combined sources. You can create more than one mapping per combiner that shares the same sources.
The following actions are available:
-
Create (+): Creates a new mapping item in the list
-
Edit (pencil): Opens the mapping engine for the selected data combination
-
Delete (trash can): Deletes the mapping from the list
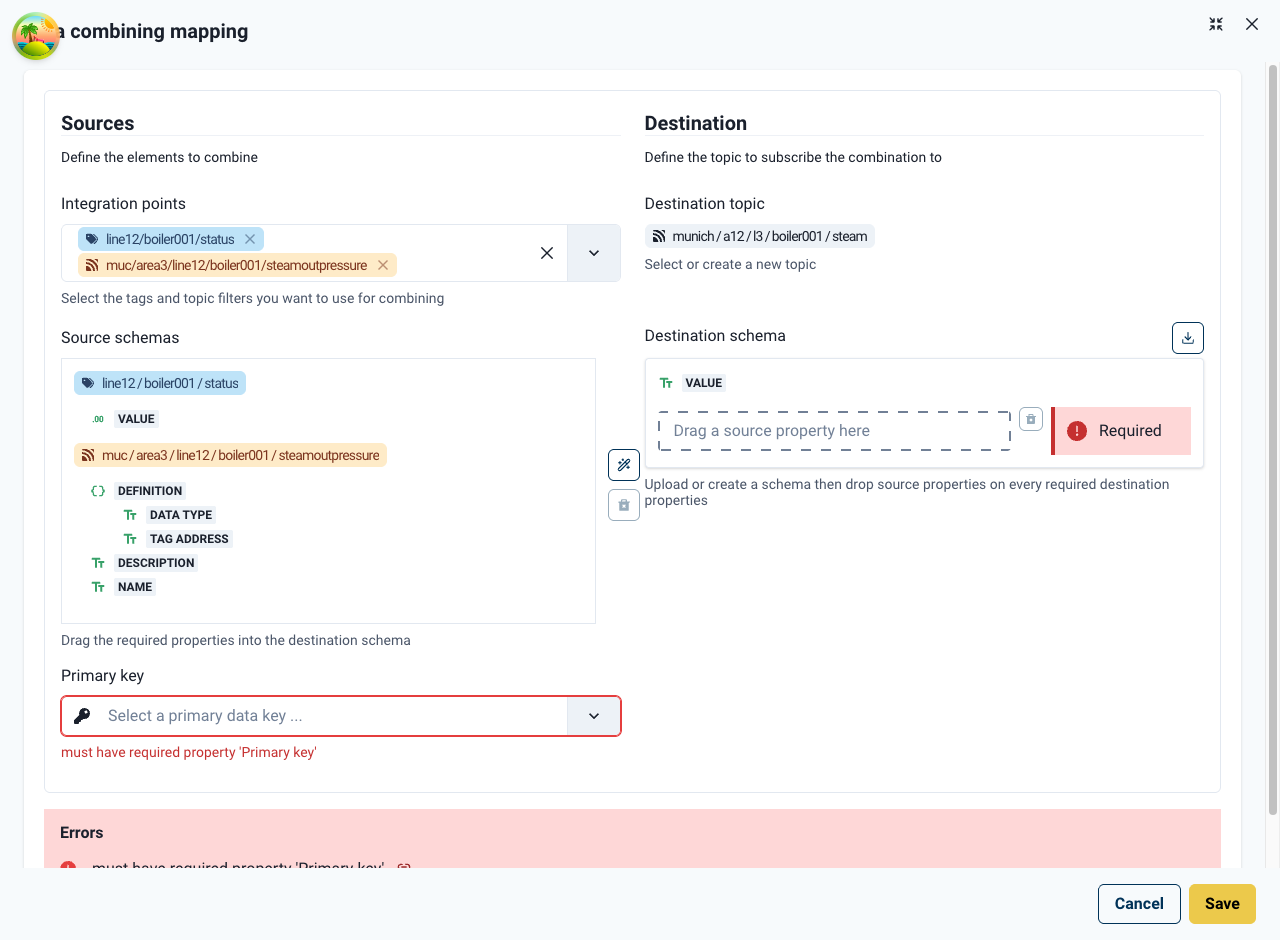
Mapping Engine
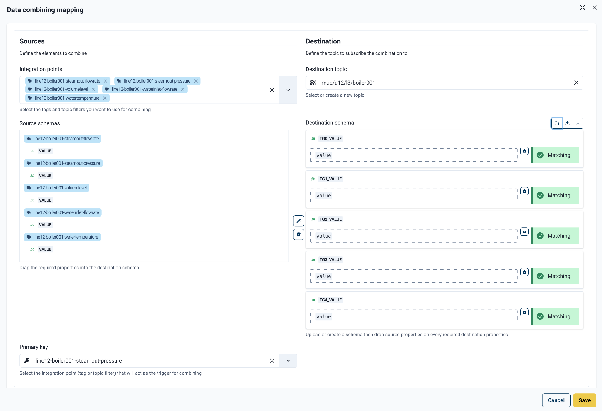
When you select the edit option for the mapping, the mapping engine opens. The engine is divided into three areas: Sources (left), Actions (center), and Destination (right).
Sources (left)
-
Integration points: Searchable selector for tags and topics available from the Sources defined in the combiner.
-
Source schemas: Lists the selected integration points with their associated schemas and usable attributes.
-
Primary Key: The tag or topic that triggers the publishing of data for the combination. Select the key you want to use as the trigger from the dropdown list.
Destination (right):
-
Destination topic: The MQTT topic to which the combined payload is published.
-
Destination schema: Defines the structure of the published payload.
| Action | Description |
|---|---|
Infer a schema (box and + icon) |
Generates a generic |
Upload a schema (up arrow icon) |
Upload a custom JSON schema to define the fields manually. |
Download the schema |
Downloads the current schema for reuse or editing. |
The schema generates fields on the right. Empty fields are highlighted in red as unmatched. Drag attributes from the left and drop them onto fields to create mappings. Each field has a trash can icon to clear it individually.
Data type indicators
A green symbol marks each field and attribute to indicate the data type as follows:
| Symbol | Type |
|---|---|
|
String |
|
Integer |
|
Number |
Actions (center)
| Symbol | Type |
|---|---|
Suggest appropriate mappings (wand icon) |
Automatically suggests appropriate attribute-to-field mappings. |
Clear mappings (trash can icon) |
Clears the schema and fields to start over. |
Once all fields are mapped (shown in green) and a primary key is selected, click Save in the bottom right corner of the engine. After saving, the combination begins to publish data to the Edge Broker.
Pulse Agent Node
Pulse Agent nodes support Assets derived from HiveMQ Pulse within HiveMQ Edge. When HiveMQ Edge is provisioned to HiveMQ Pulse, it creates an Agent node in the Workspace to support the mapping of an asset derived from HiveMQ Pulse which is pushed down to HiveMQ Edge and is accessible from the Assets list via the main menu bar.
Asset Mapping
To map an asset and initiate northbound publishing, you must create an Asset Mapper to connect to your data sources. Make a group selection that incorporates the adapter nodes that contain the tags relevant to one or more target assets and the Pulse Agent node. Similar to when creating a data combination except you also incorporate the Pulse Agent node.
To create a new node, click Create a new Asset Mapper from the selection in the selection toolbar.
An unnamed asset mapper appears on the workspace that is connected to every node you selected as sources and to the Broker node as the target.
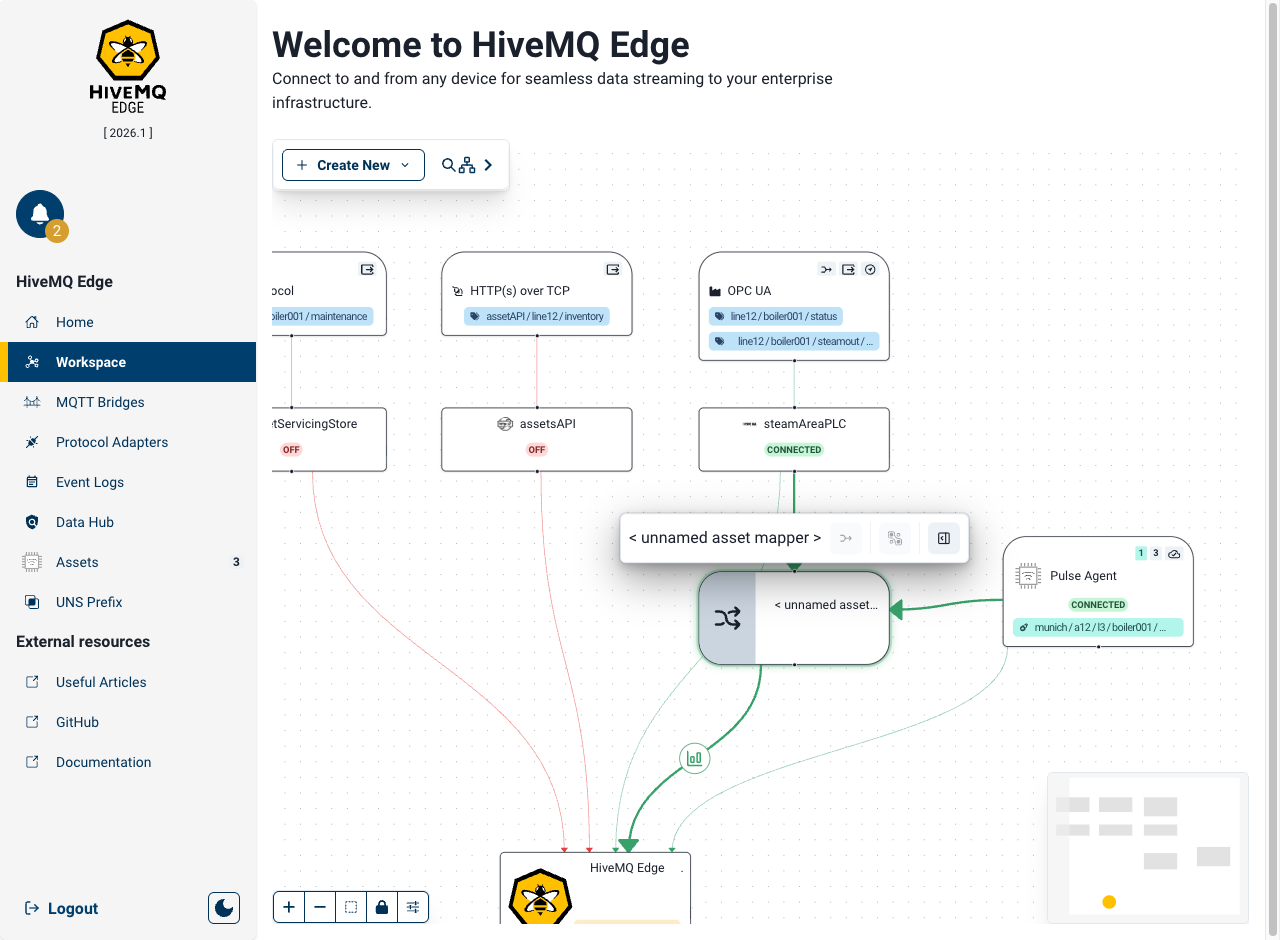
Once an Asset Mapper is created and associated with the relevant data sources, you can map individual assets by clicking on the 'Overview panel' button in the toolbar to open the Asset Mapper configuration panel which enables users to configure and map the asset.
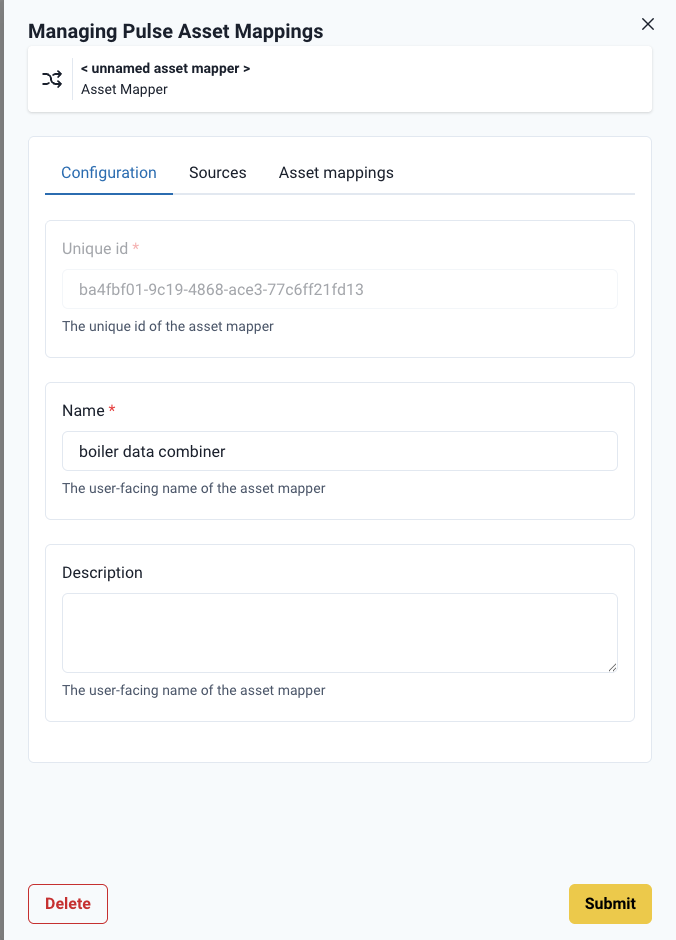
Configuration
-
Unique ID: HiveMQ Edge automatically generates this identifier. You cannot edit the Unique ID.
-
Name: Set a user-defined name for the asset mapper here.
-
Description: User-defined description of what the asset mapper is for
Sources
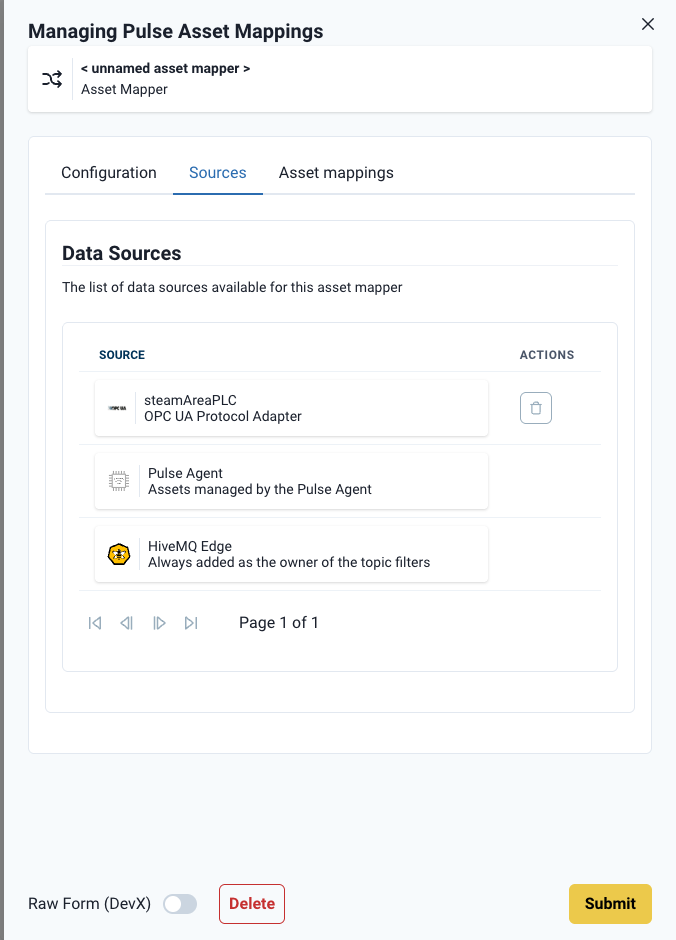
A paginated list of data sources for the Asset Mapper appears here. The Broker node is always a default source that enables the utilization of Topic Filters in the mapping engine.
Asset Mappings
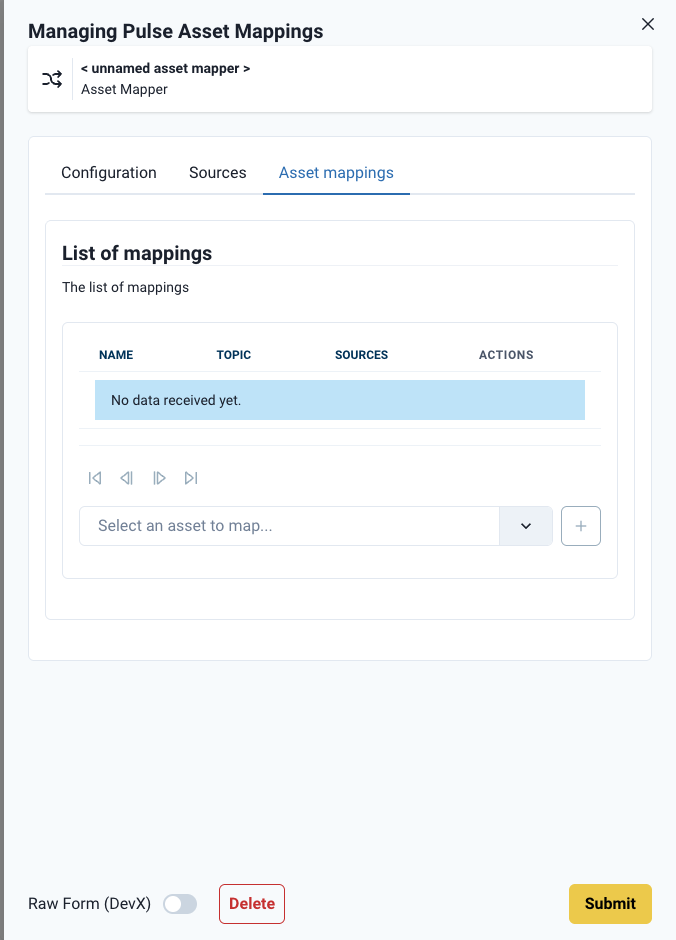
The Asset Mappings tab is where you map HiveMQ Pulse-derived assets to data sources. It displays a paginated list of any pre-mapped assets currently publishing topics to the Edge Broker.
Below the paginated view, a dropdown contains any unmapped assets relevant to the selected sources. To map a new HiveMQ Pulse-derived asset, select the asset from the dropdown and click +.
A new entry is added to the paginated view, pre-populated with the destination topic.

Select the pencil icon to open the mapping engine for the selected asset.
The mapping engine is identical to the one utilized in Data Combiners, with one exception: the destination topic and schema are predefined by HiveMQ Pulse and cannot be changed.
The mapping engine works identically to the one used in Data Combiners, with one exception: the destination topic and schema are predefined by HiveMQ Pulse and cannot be changed.

In the Integration points selector on the left, select the tags (available from your selected data sources) and topic filters (available from your Broker node) you want to map to the destination schema on the right.
With the selected sources now listed on the left-hand side of the mapping engine, you can now drag and drop the relevant sources to the destination fields on the right-hand side.
| The data property types must match or the mapping fails. For example, if the schema expects a string value and you drag an integer to the field, the mapping fails. |
You must also select which of the selected integration points acts as your primary key (the trigger for publishing).
Once all fields are green and a primary key is selected, click Save (bottom right). The mapping engine closes and returns to the paginated view.
Successfully mapped assets appear as Streaming in the Assets list, accessible from the main menu.
MQTT Bridges
HiveMQ Edge supports bidirectional MQTT bridging that allows you to connect Edge to remote HiveMQ Enterprise or Cloud brokers. Multiple bridges can be configured, each with independent local and remote topic filters to control what is published northbound and subscribed to southbound.
Bridges can be created in two ways:
-
From the Bridges section in the main navigation menu
-
With the Creation Wizard in the Workspace Toolbox.
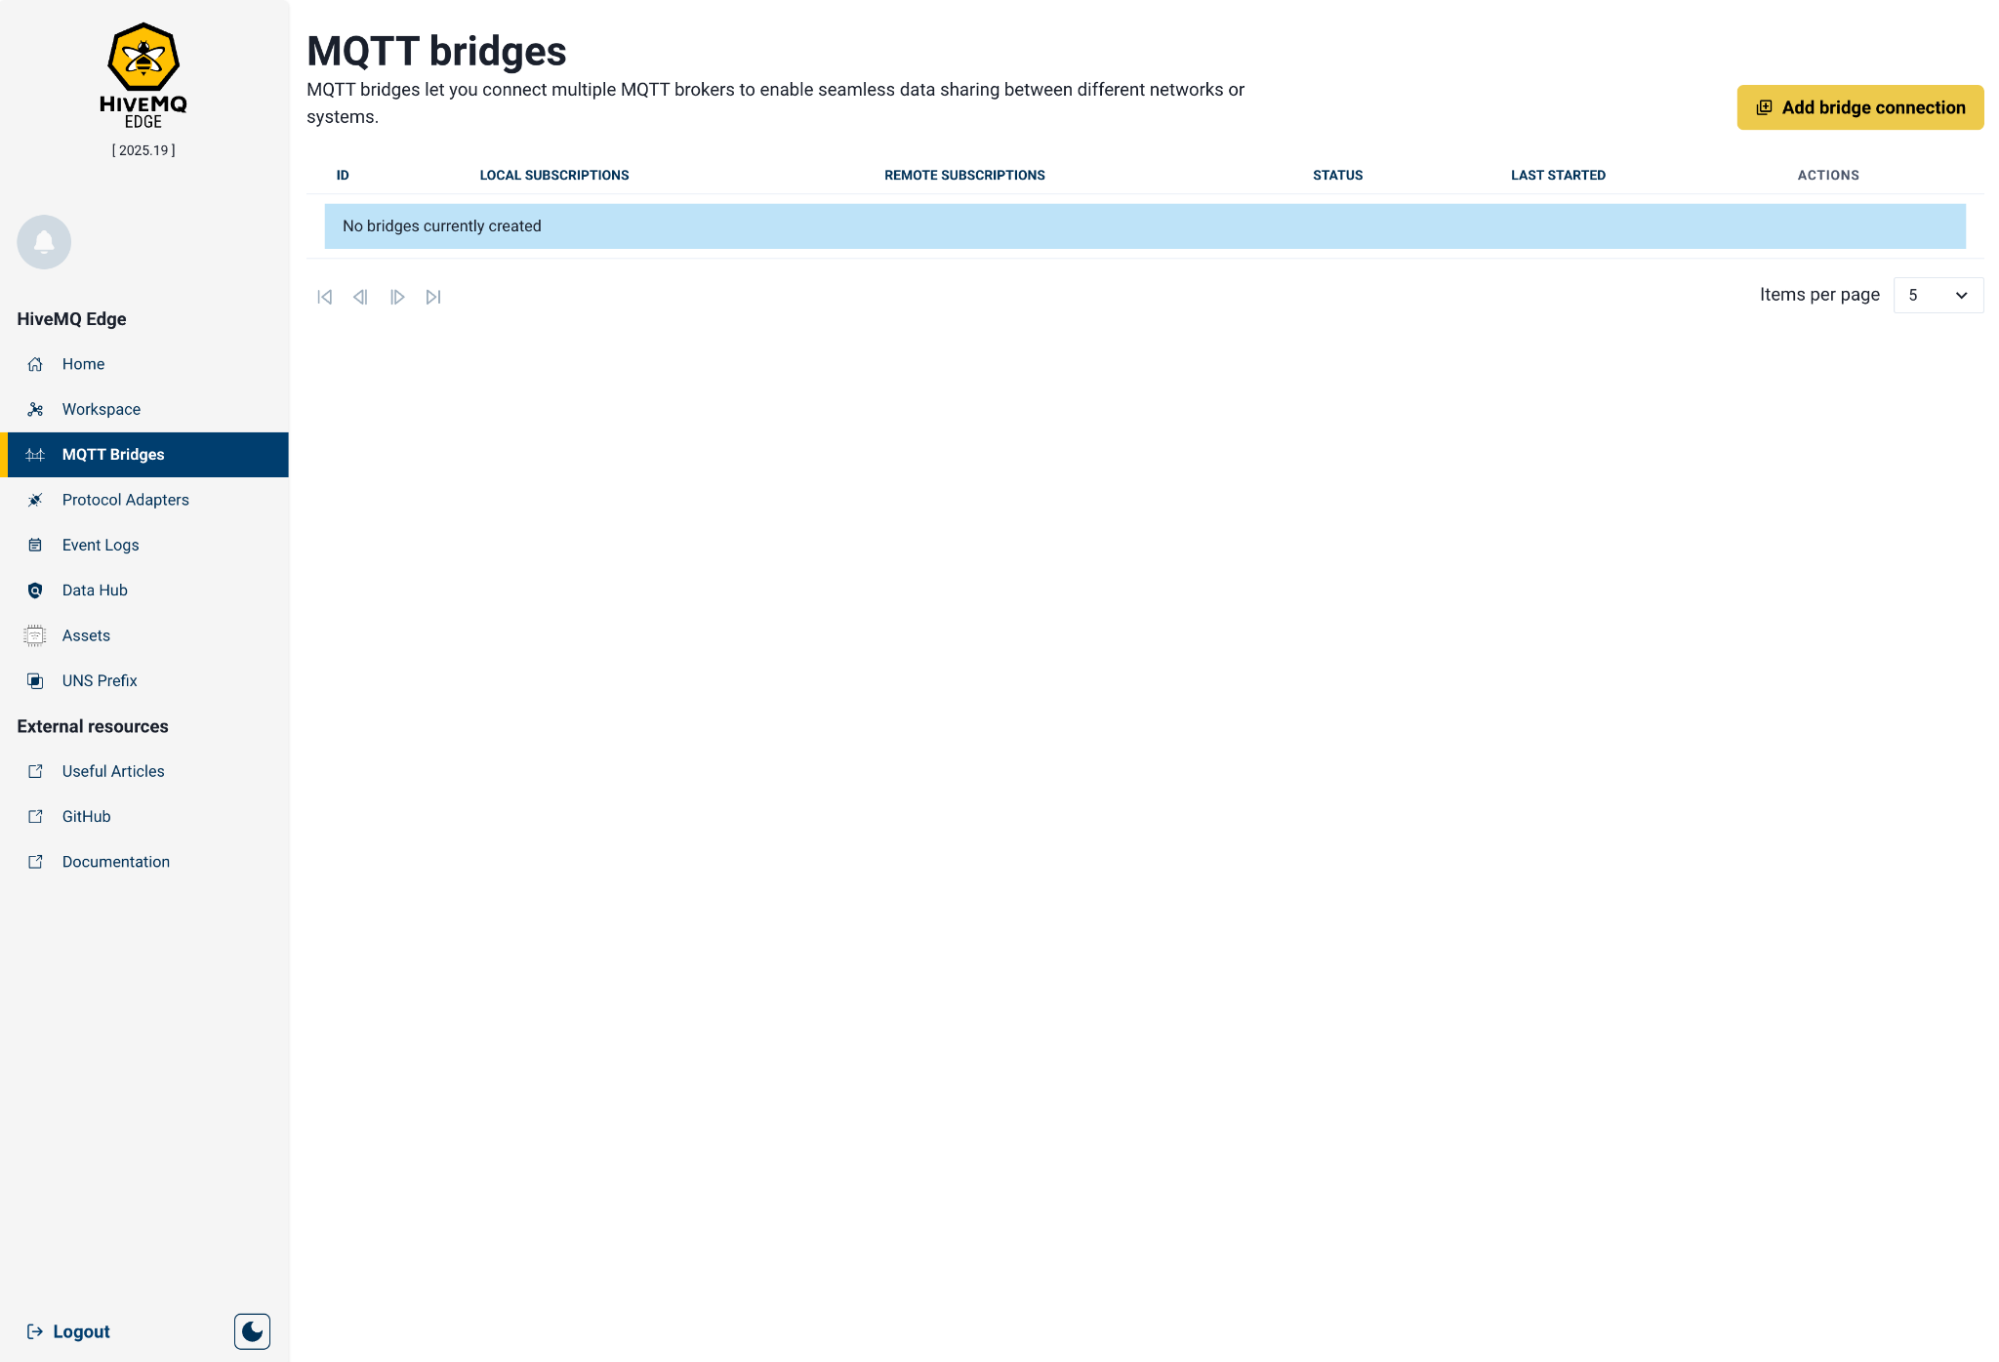
To add a bridge, select Add bridge connection in the top right corner of the Bridges page.
Connection Management
When you select Add bridge connection, a side panel with five configuration tabs opens.
| Tab | Description |
|---|---|
Connection |
Manages the endpoint and user-defined identifiers for the connection. |
Broker Configuration |
Provides specific remote broker connection parameters. |
Subscriptions |
Defines local and remote subscriptions to filter what topics to publish northbound and subscribe to southbound. |
Security |
Provides multiple methods to secure and authenticate the connection to the remote broker. |
WebSocket |
Enables WebSocket connections over HTTP. |
Bridge Connection Tab
The following fields are available:
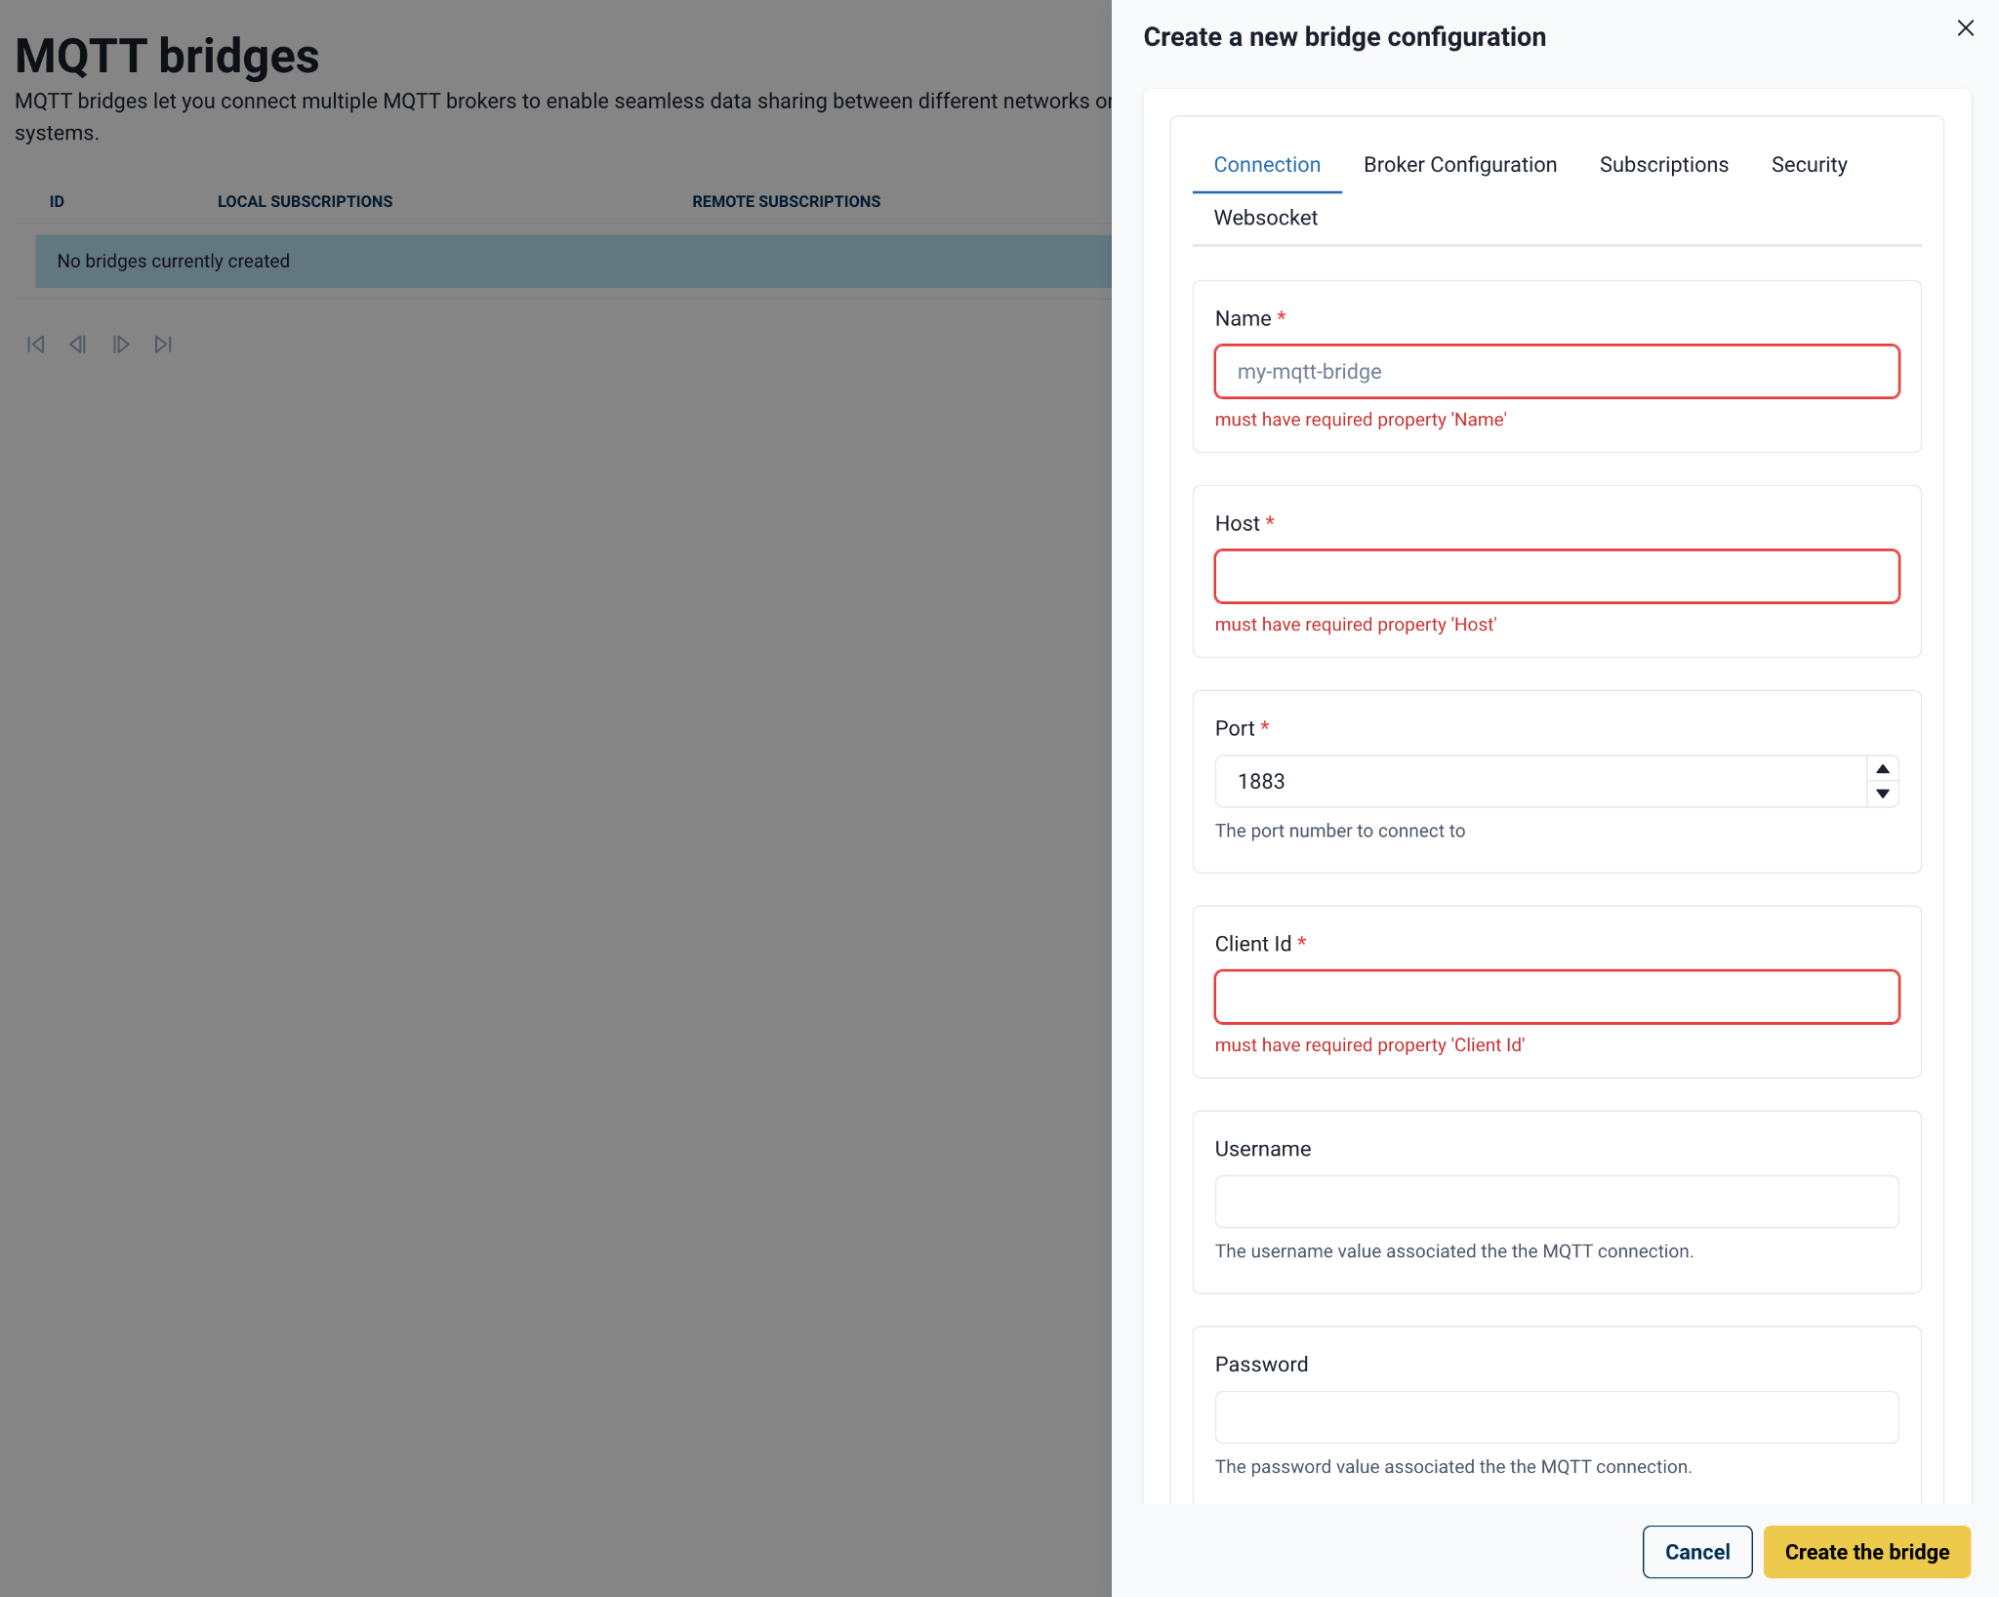
Mandatory fields are marked in red.
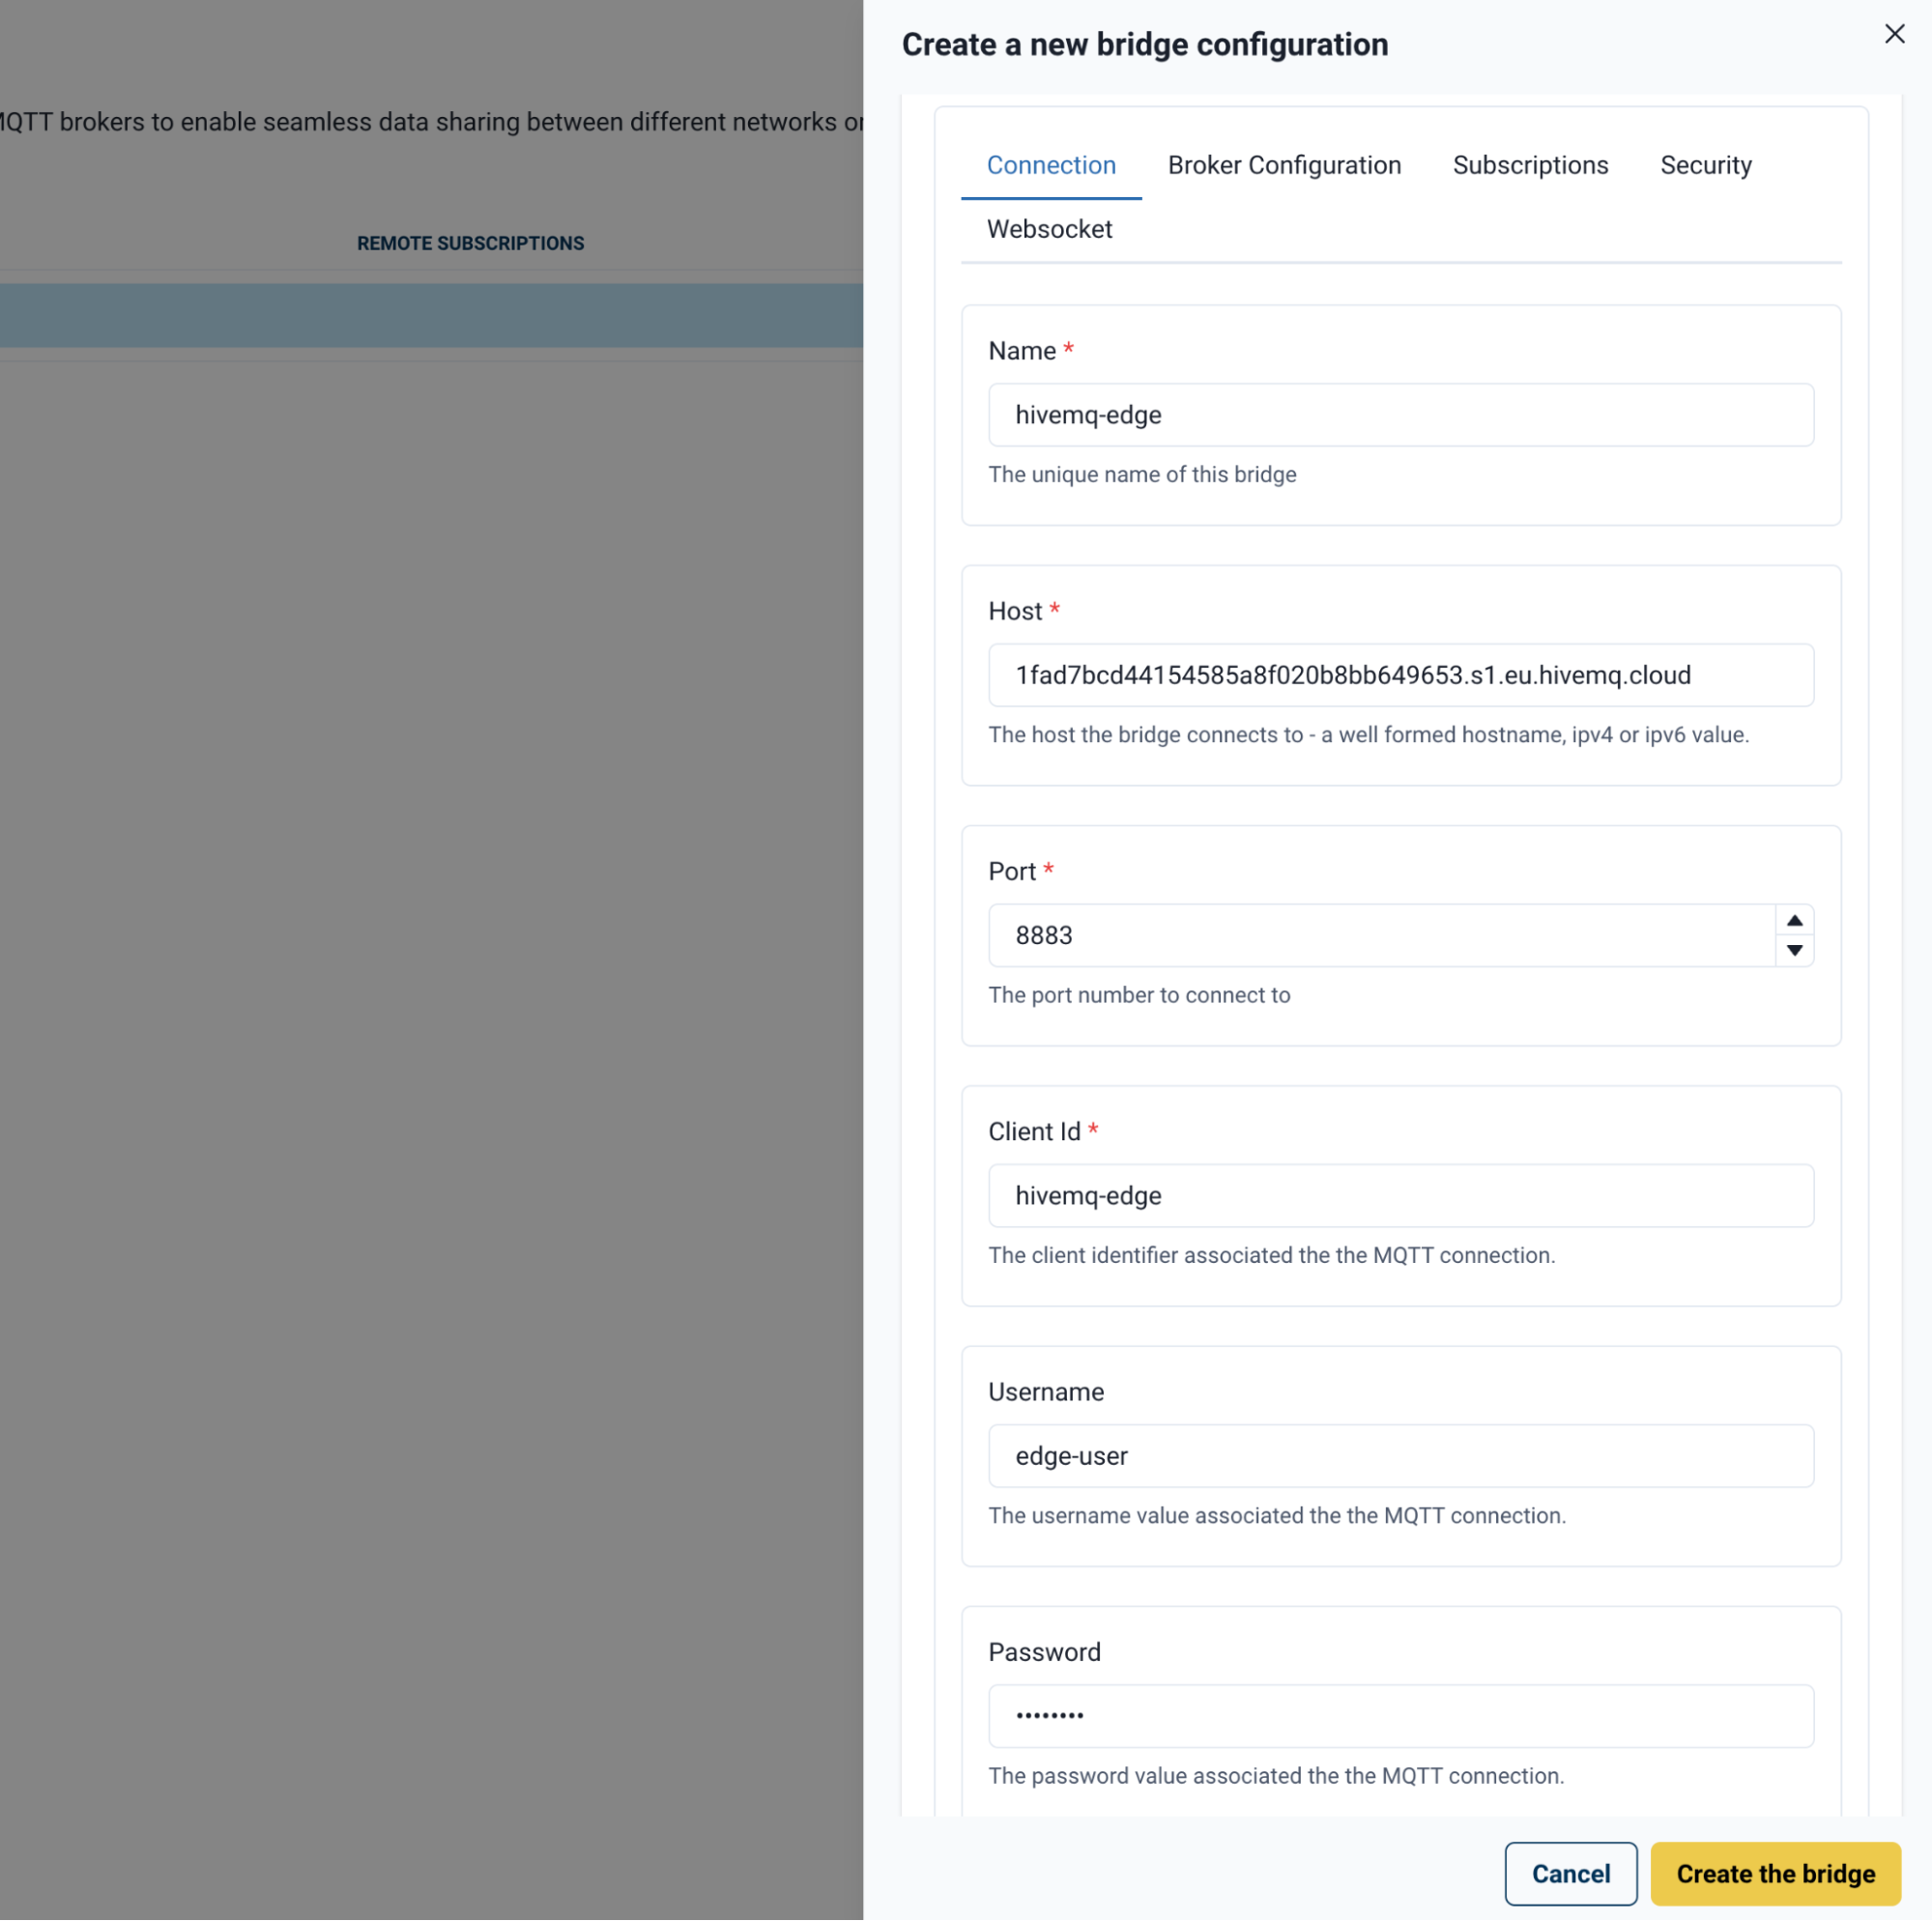
| Field | Description |
|---|---|
Name |
user-defined identifier for the bridge connection. |
Host |
Address of the remote broker to which you connect HiveMQ Edge. |
Port |
Port of the remote broker. The default setting is |
Client ID |
User-defined client identifier sent to the remote broker. Specify a specific ID to enable authentication with the remote broker based on the security configuration of the remote broker. |
Username |
Connection username, if required. |
Password |
Connection password, if required. |
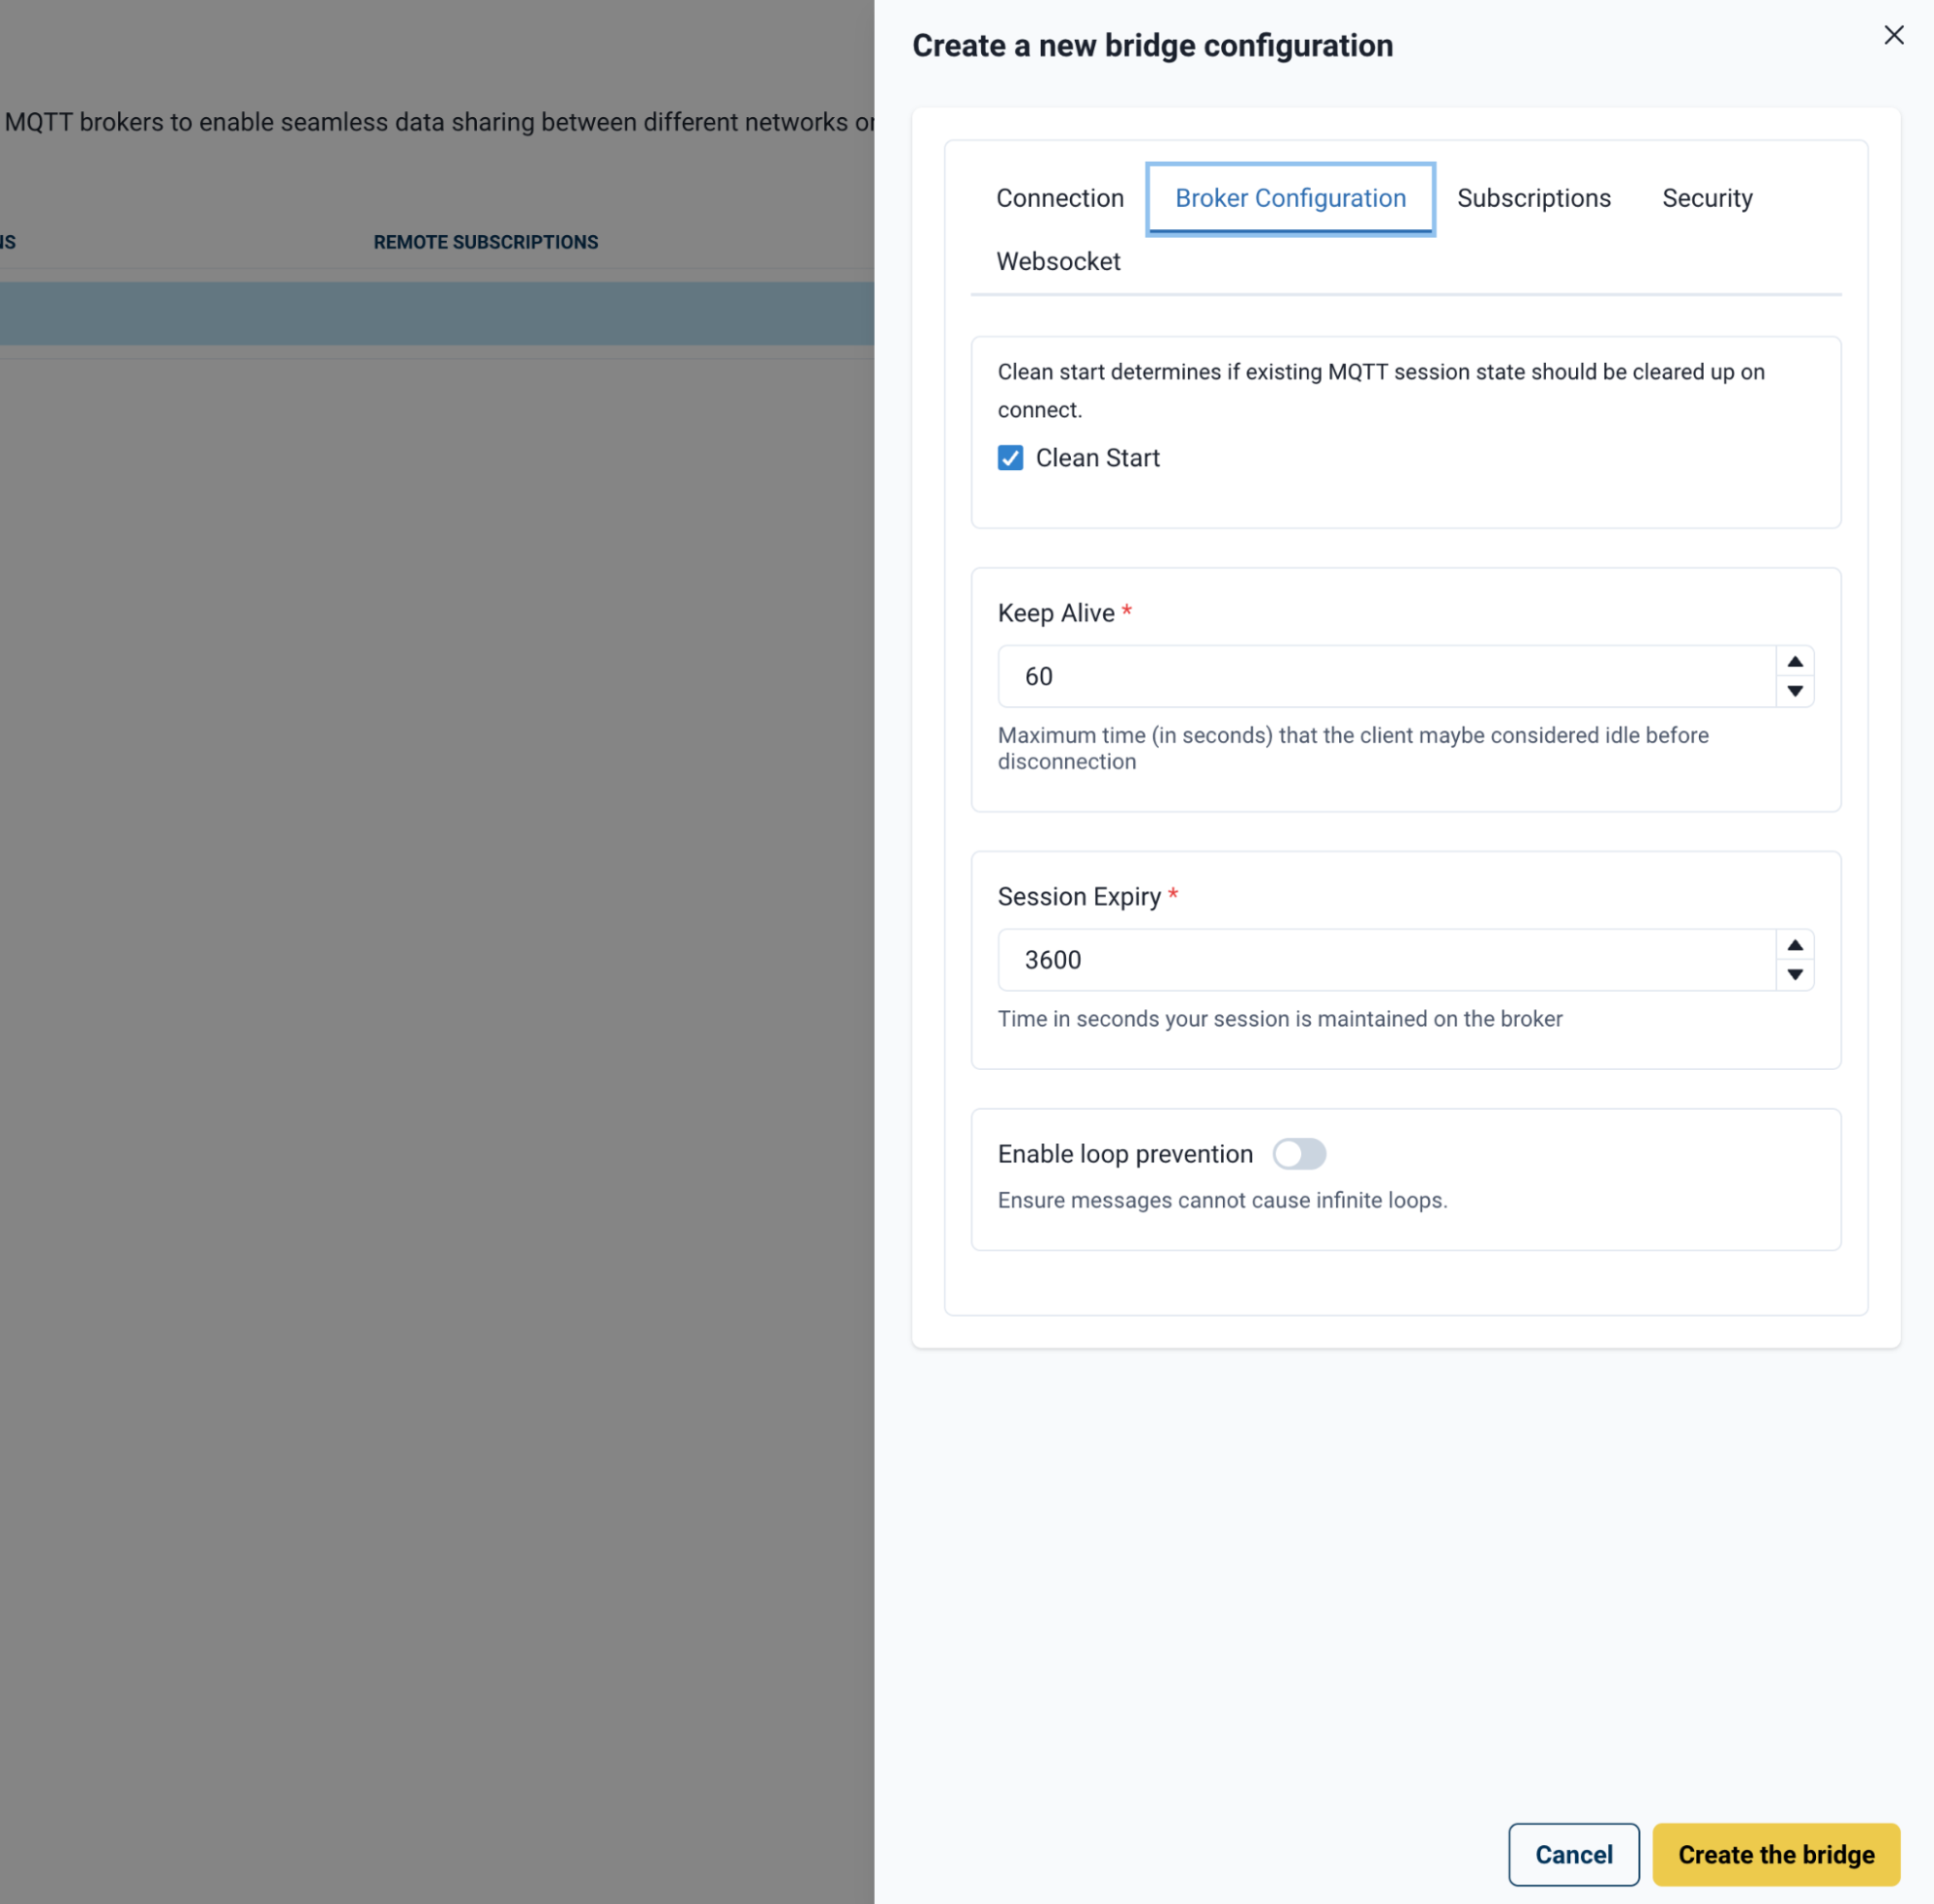
Bridge Broker Tab
The broker configuration settings use standard MQTT defaults. Adjust as needed for your environment:
| Field | Default | Description |
|---|---|---|
Clean Start |
On |
Session states are cleaned on connect and reconnect to the broker. |
Keep Alive |
— |
For flaky connections or remotely constrained connections, increase the keep-alive value to prevent the broker from disconnecting HiveMQ Edge. |
Session Expiry |
— |
Increase this value to persist the session longer for flaky or constrained connections. |
Enable loop prevention |
Off |
Enable if you use symmetric subscriptions (for example, publishing and subscribing on the same topic), to avoid possible message loops. |
Bridge Subscriptions Tab
Subscriptions control the flow of messages between HiveMQ Edge and the remote broker:

-
Local subscriptions: The bridge subscribes to topics in the HiveMQ Edge broker and forwards them northbound to the remote broker.
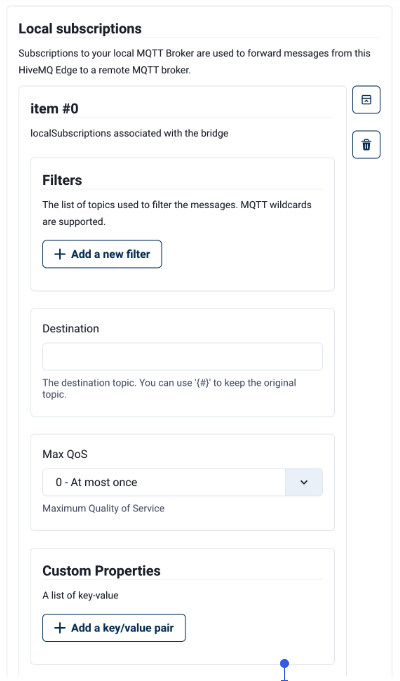
-
Remote subscriptions: The Edge broker subscribes to topics on the remote broker and receives them southbound.
The following options are available when configuring a subscription. All options apply to both local and remote subscriptions. For remote subscriptions, filters refer to topics on the remote broker, and the destination topic is published into the HiveMQ Edge broker.
| Option | Description |
|---|---|
Filters |
One or more topic filters (supports MQTT wildcards) to select topics from the HiveMQ Edge broker to publish under a single topic to a remote broker. |
Destination topic |
The topic under which filtered messages are forwarded the remote broker. |
Max QoS |
Sets the maximum QoS level permitted on the destination topic. Messages published at a higher QoS are downgraded to this level. |
Custom Properties |
Key-value pairs added as MQTT5 User Properties on the destination topic. Useful when consolidating multiple filters under a single topic. |
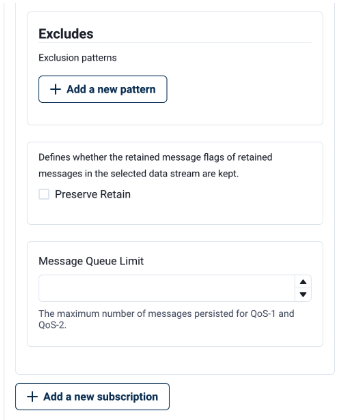
Excludes |
Isolates specific topic patterns to omit from the subscription. Useful when wildcards are in use. For example, |
Preserve Retain |
When enabled, sets the retain flag on the destination topic. |
Message Queue Limit |
Limits the number of persisted messages in the queue for QoS1 and 2 messages. |
Add a new subscription |
Creates an additional subscription configuration below the current one. |
Bridge Security Tab
By default, the Security tab displays only a TLS toggle:
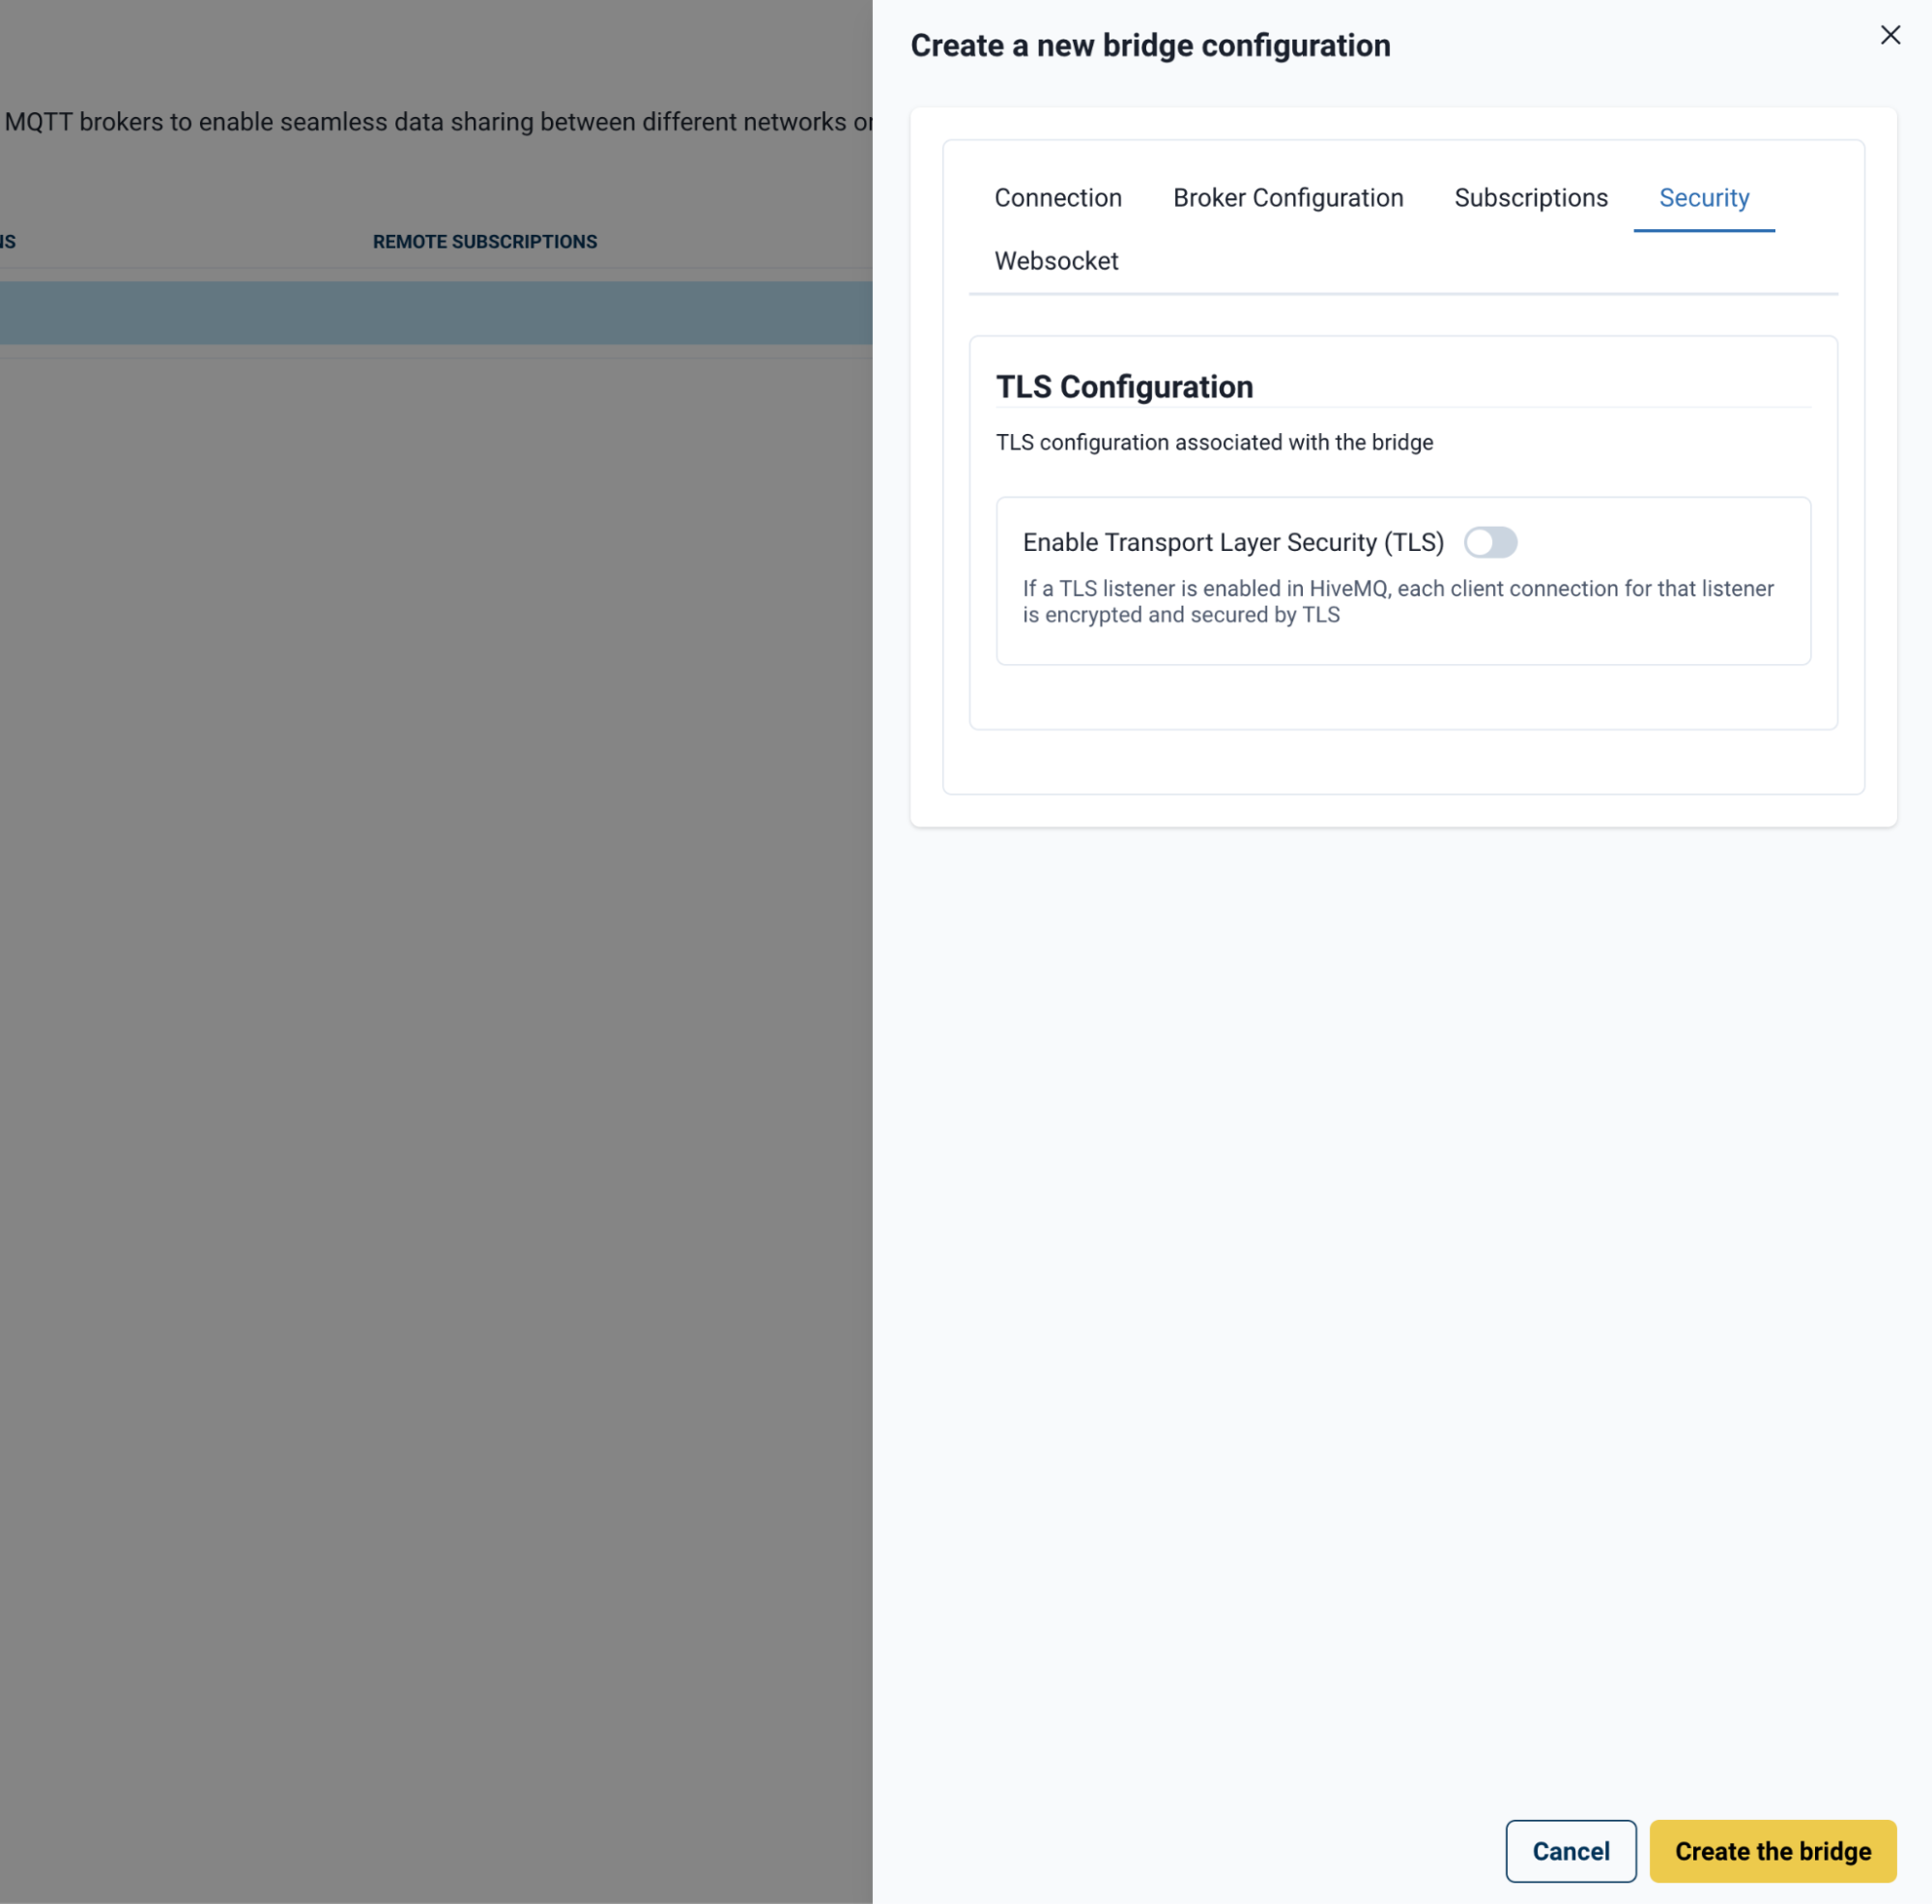
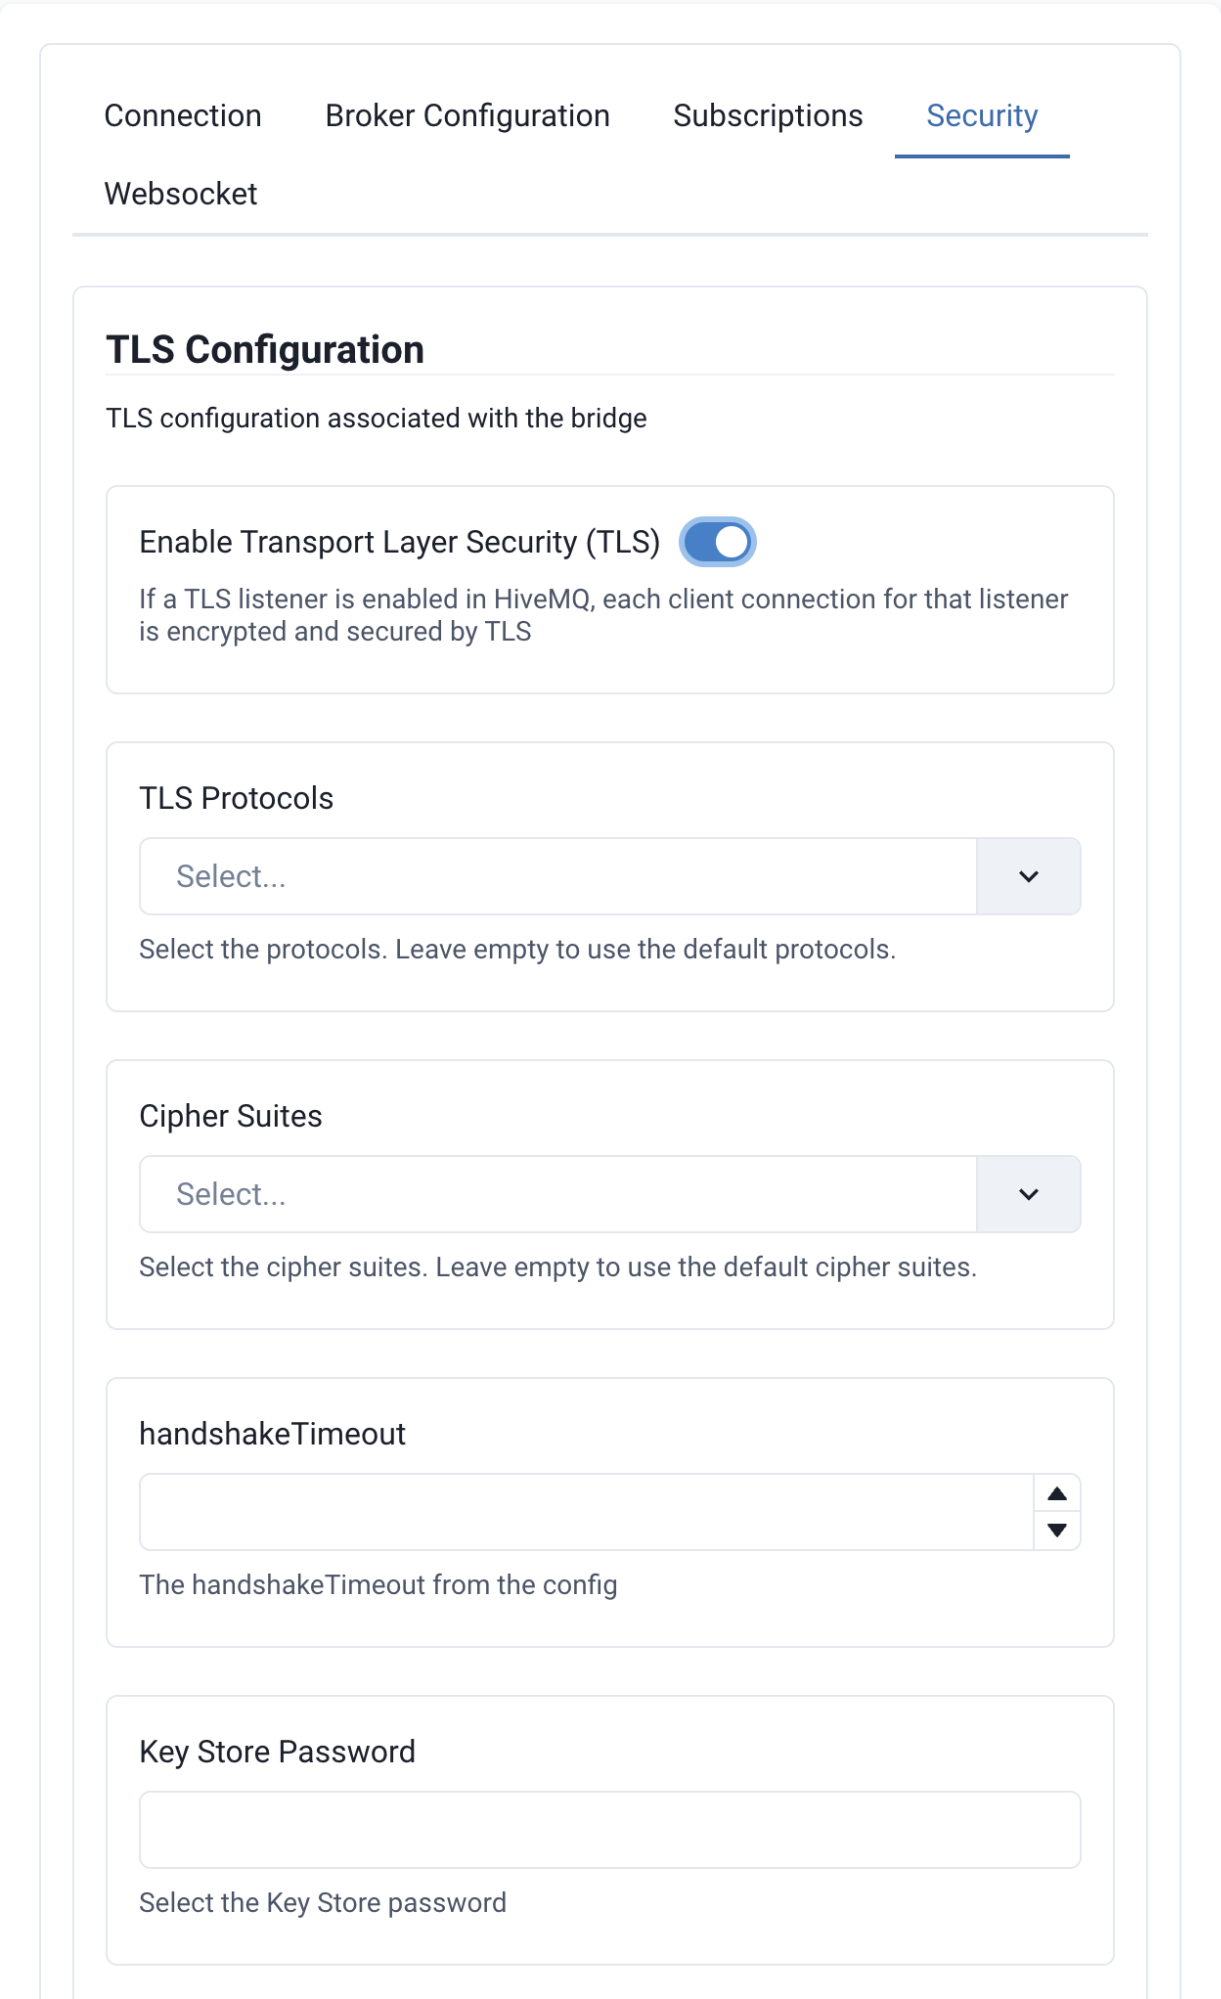
When you enable TLS, the panel expands to reveal advanced configuration options:
| If TLS is enabled without any additional configuration, the bridge attempts to connect with the username and password defined in the Connection tab over a standard TLS connection. |
The following security options are available:
| Field | Description |
|---|---|
TLS Protocols |
Select the TLS version to use for the bridge connection. |
Cipher Suites |
Select one or more cipher suites to define the preferred encryption method. |
Handshake Timeout |
Set the timeout duration for the TLS authentication handshake. |
Verify Host Name |
Enable verification that the hostname of the remote broker matches its TLS certificate. |
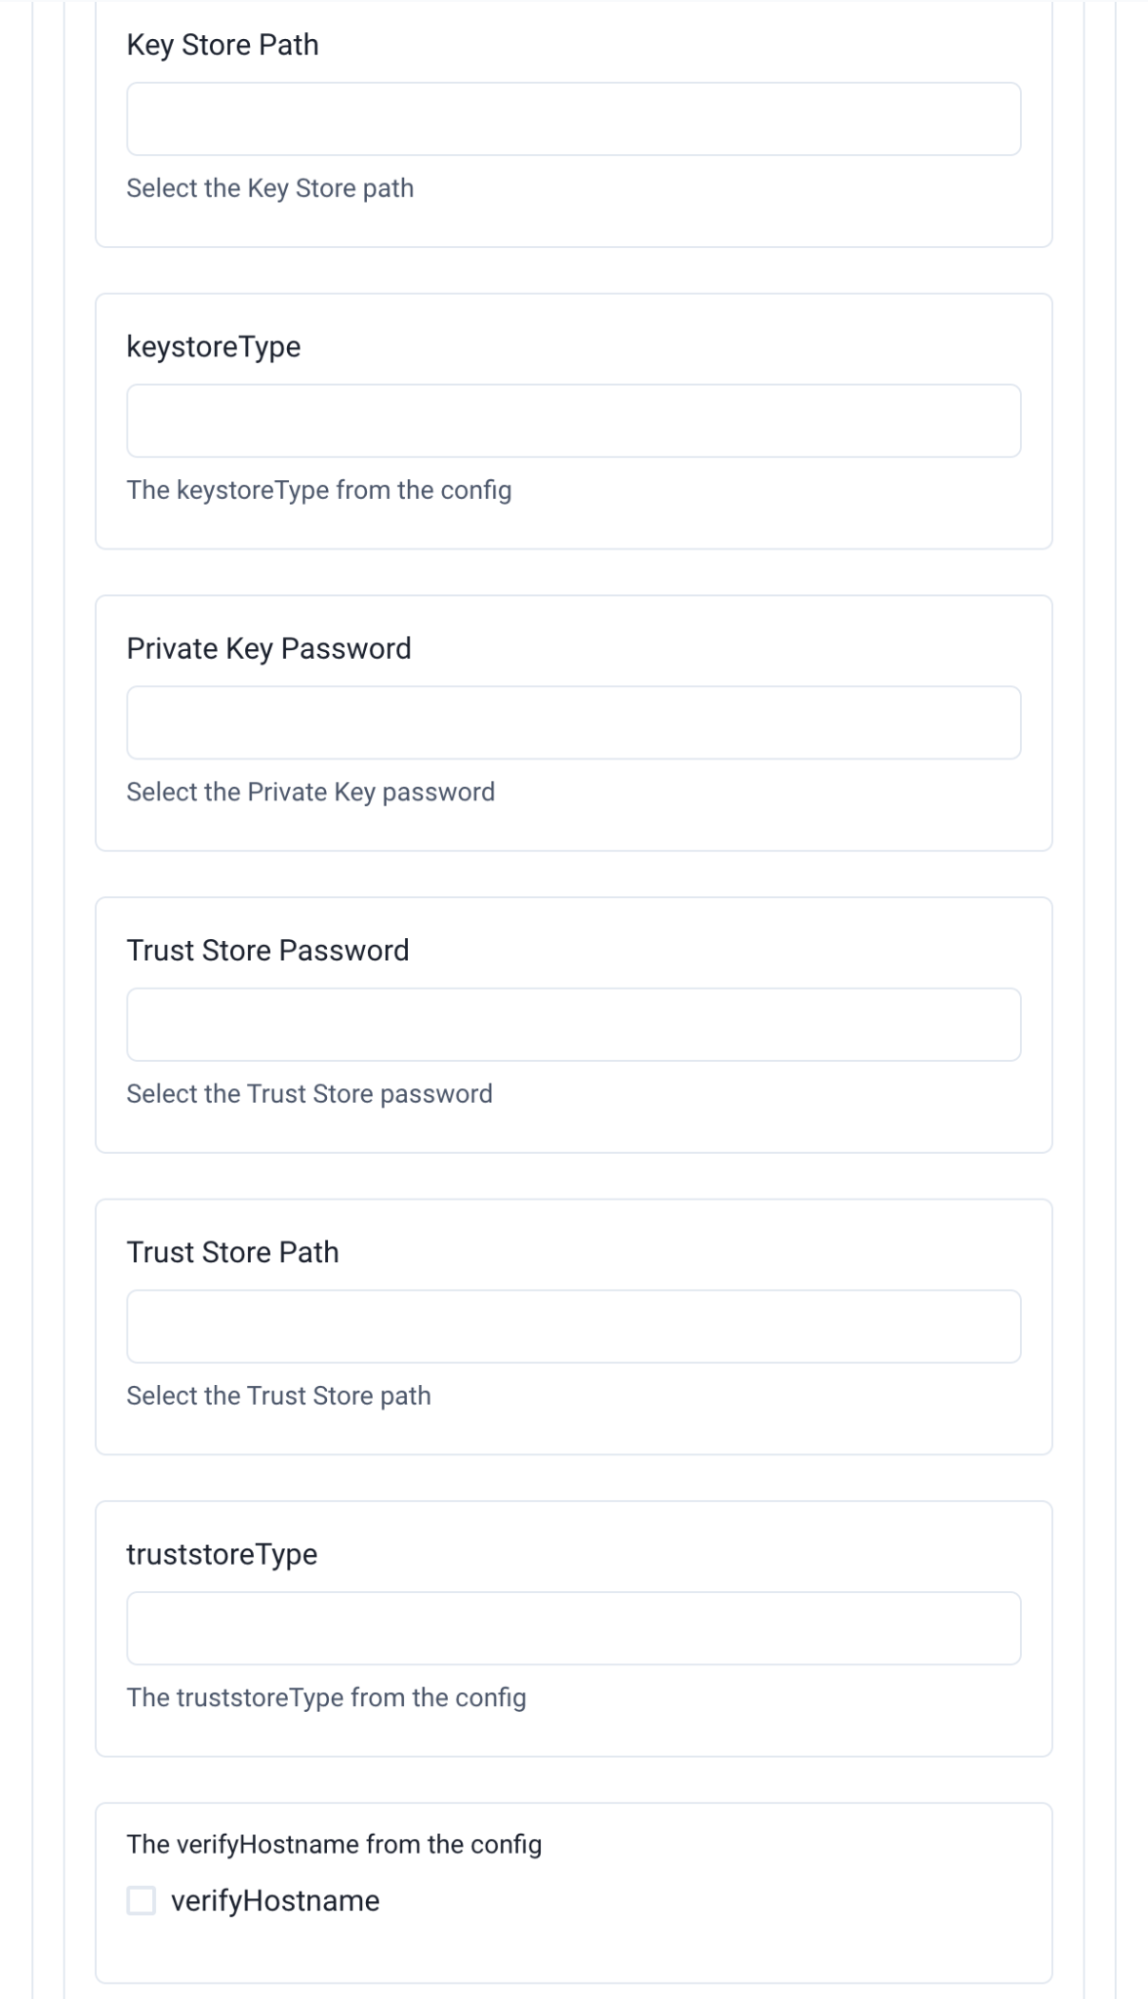
| Field | Description |
|---|---|
Key Store Path |
Path to the keystore file. |
Keystore Type |
Keystore format (for example, |
Keystore Password |
Password for the keystore. |
Private Key Password |
Password for the private key, if applicable. |
| Field | Description |
|---|---|
Trust Store Path |
Path to the truststore file. |
Trust Store Type |
Truststore format (for example, |
Trust Store Password |
Password for the truststore. |
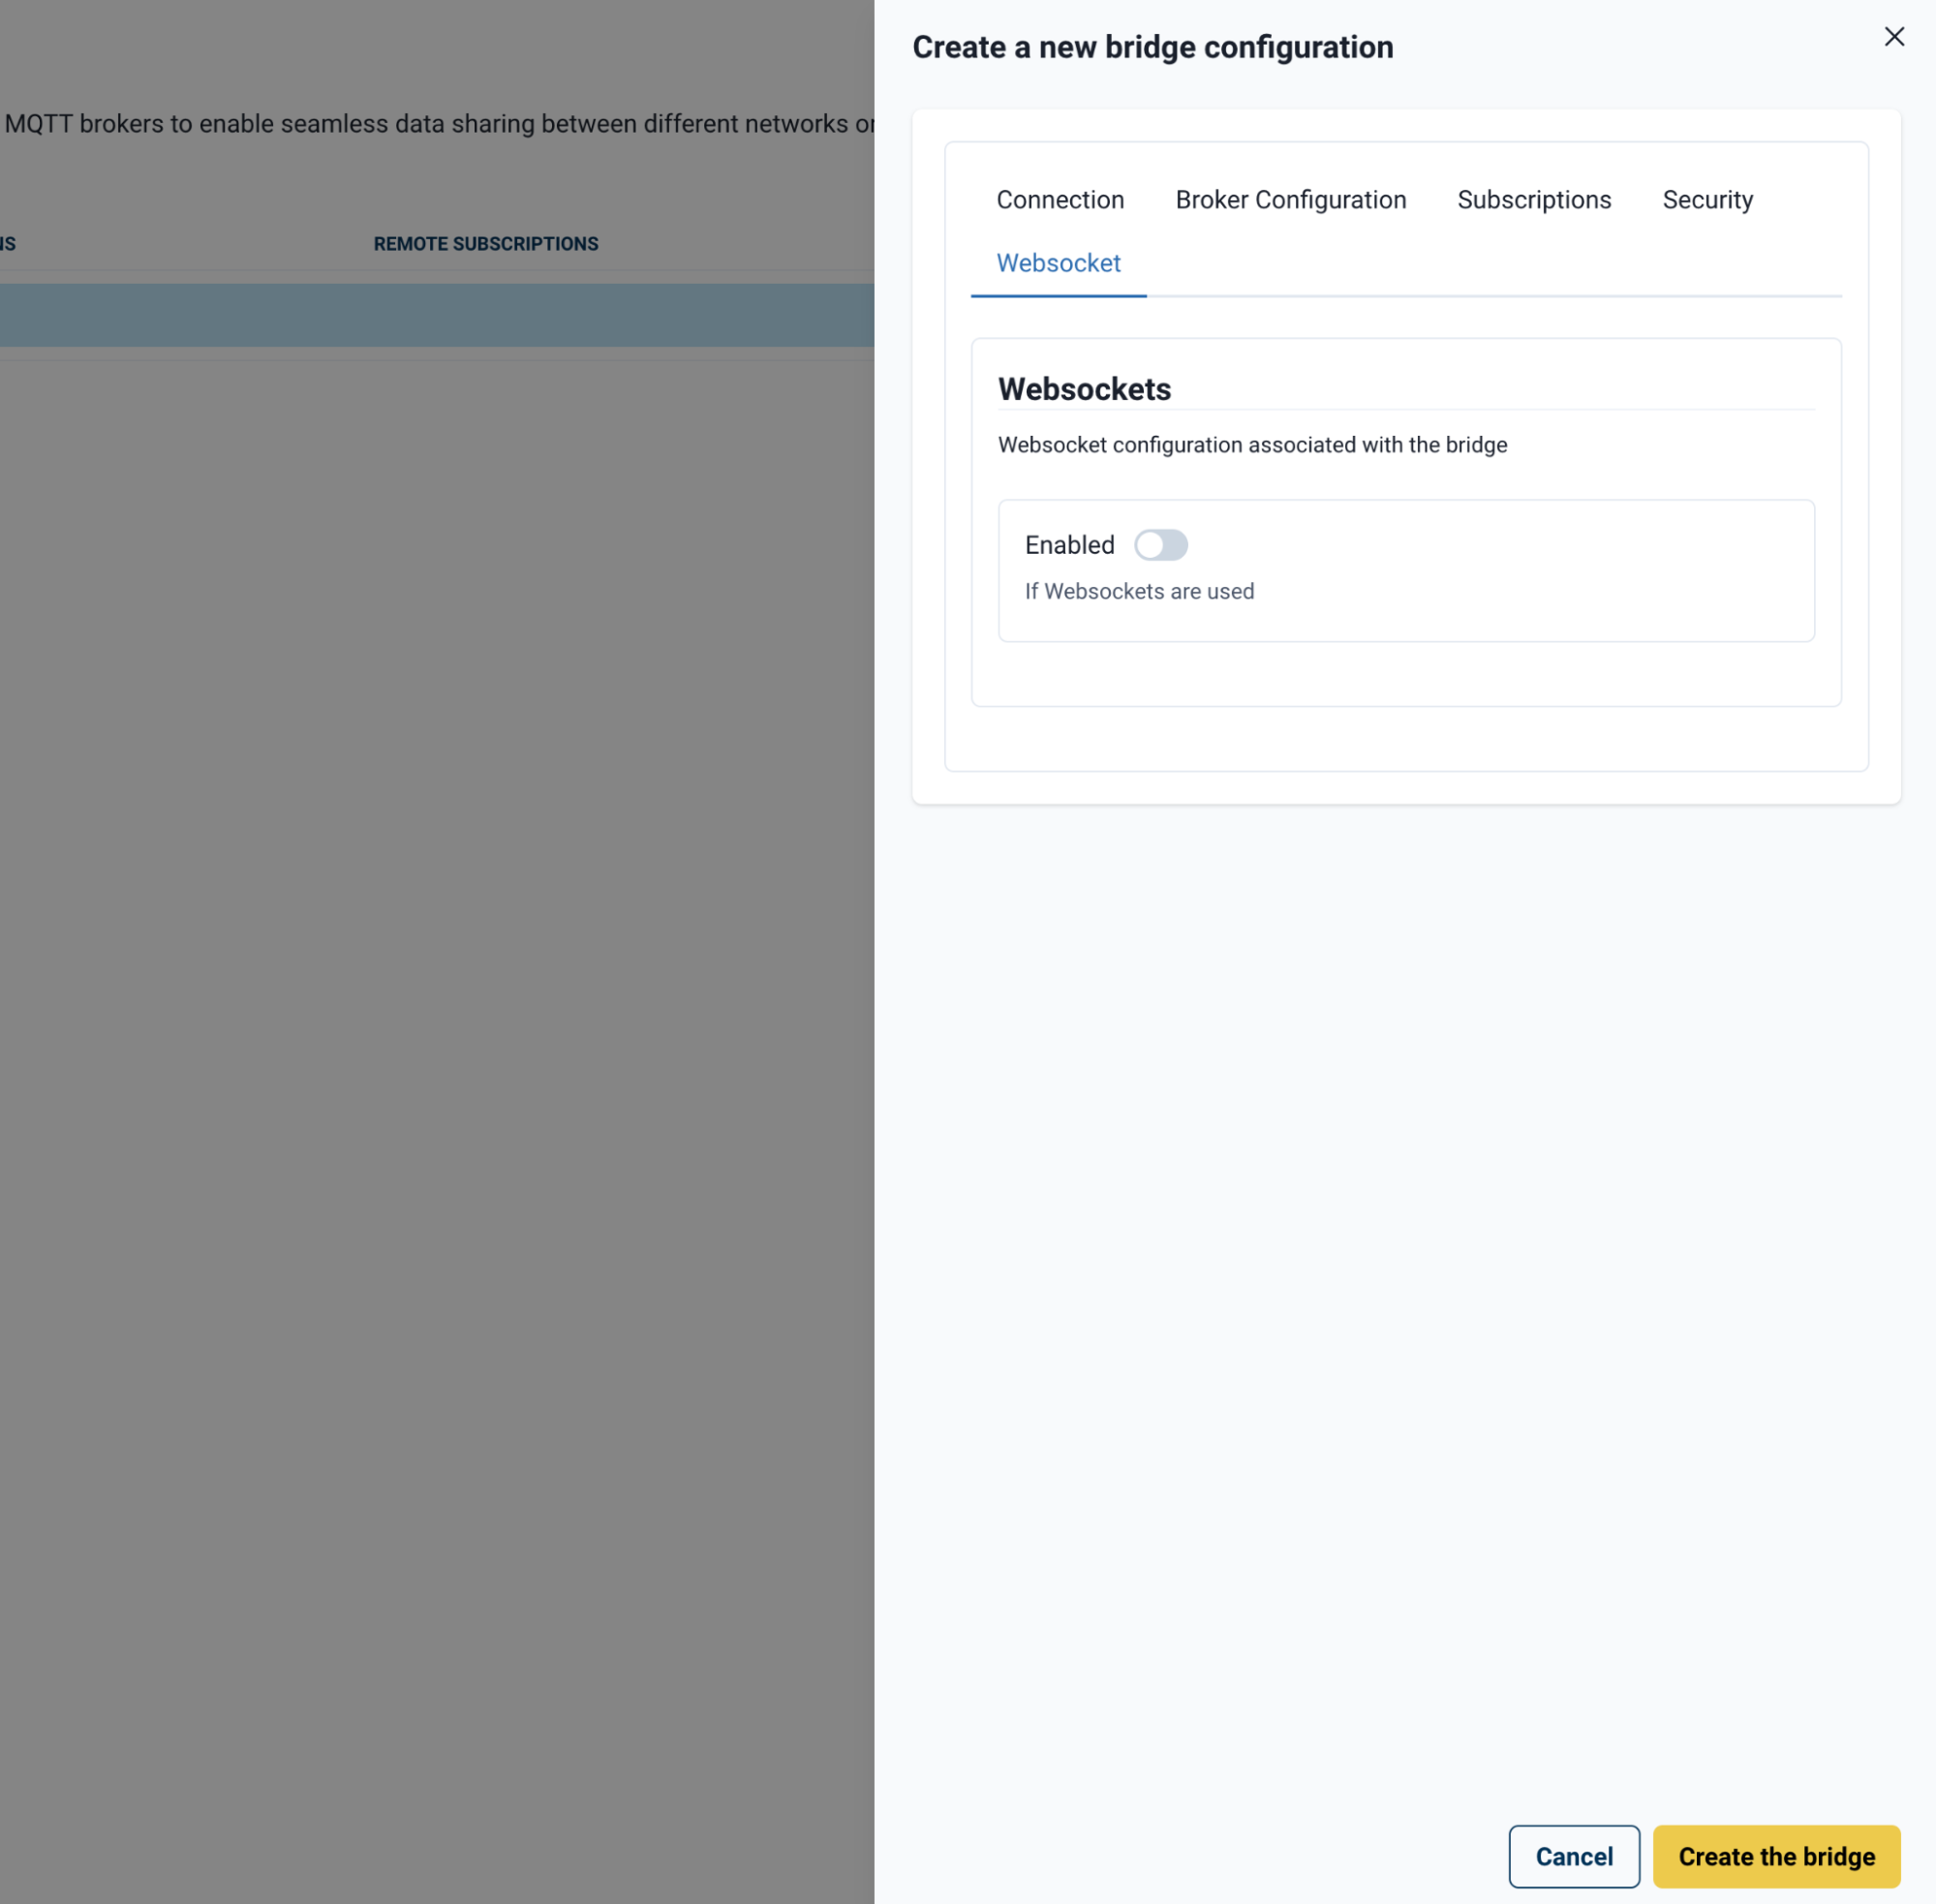
Bridge WebSocket Tab
When you enable WebSockets, the WebSocket panel expands:
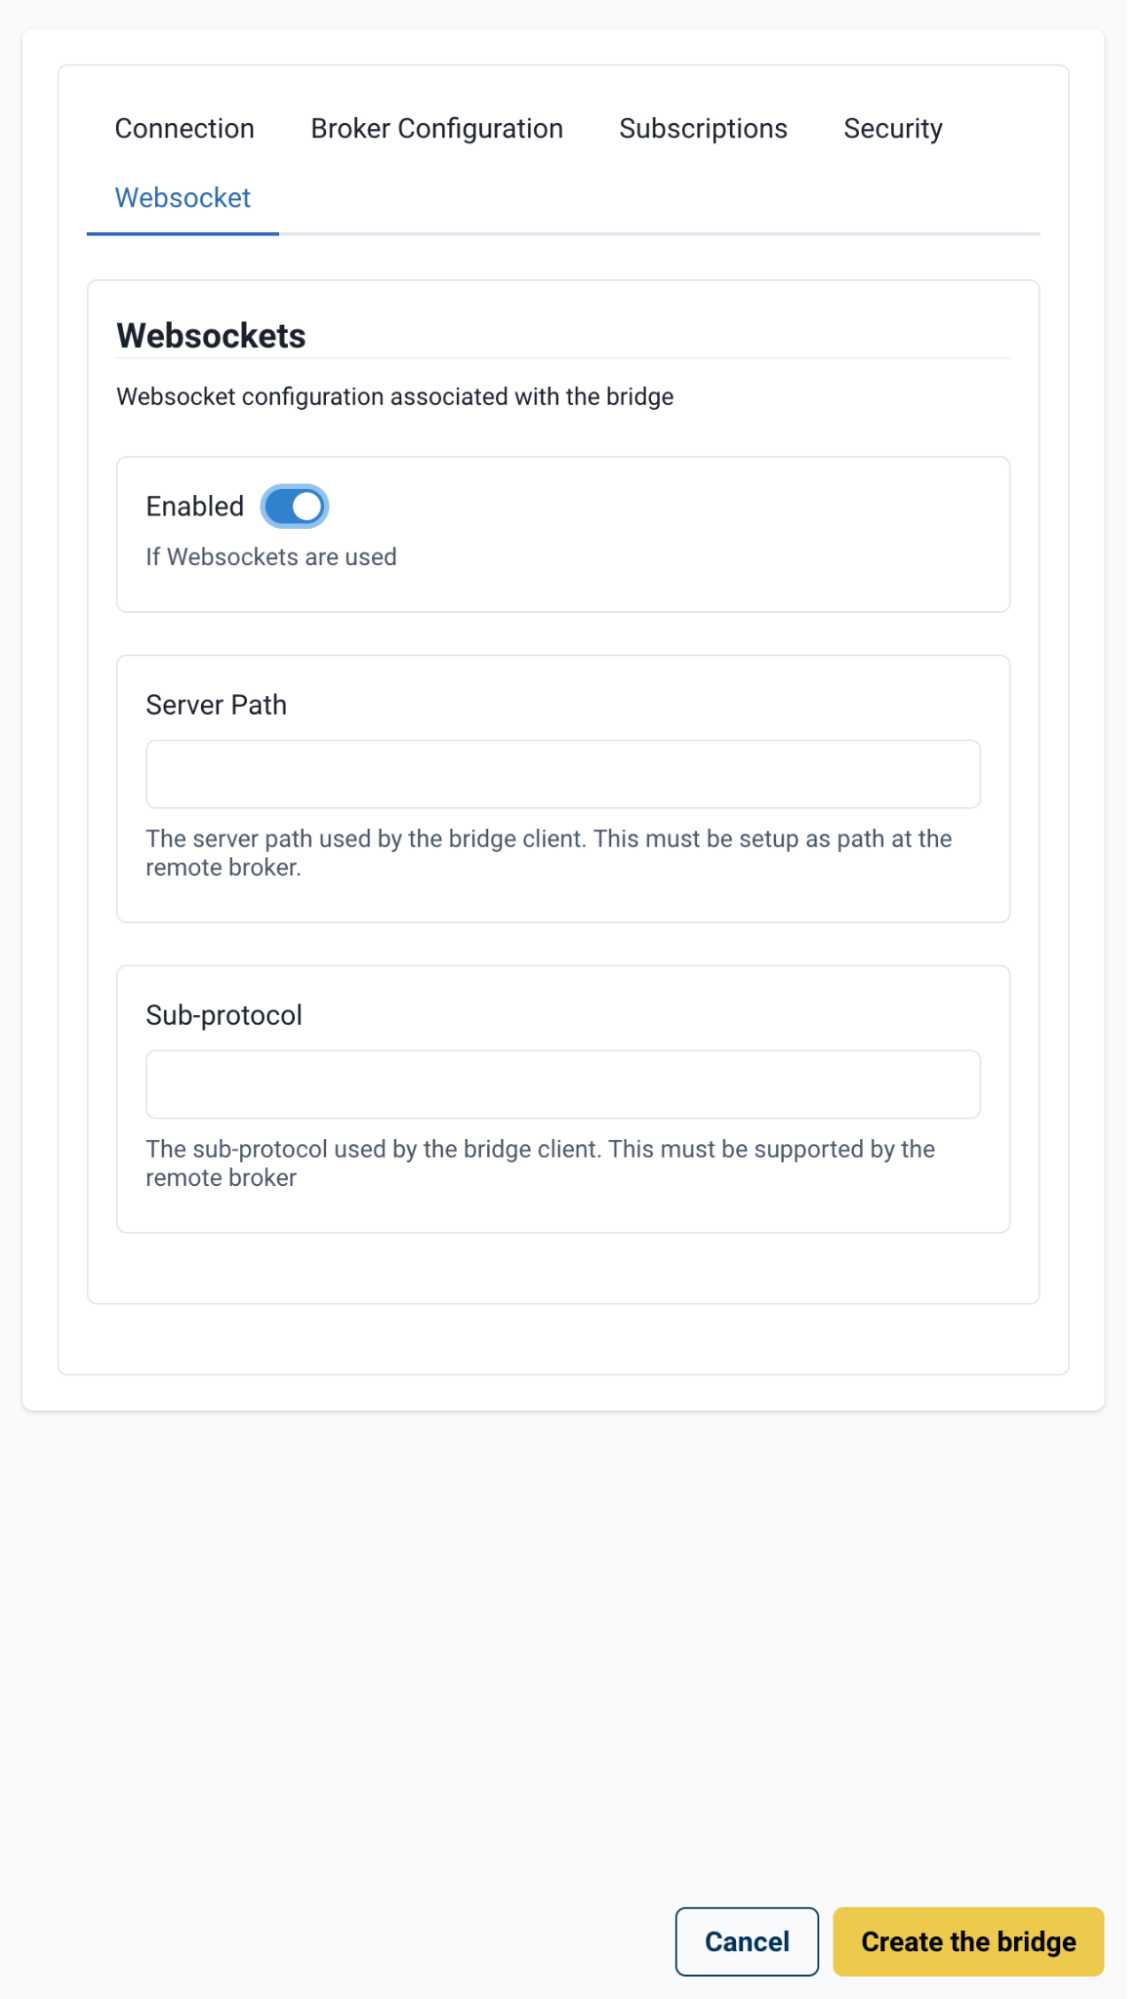
The following WebSocket options are available:
| Field | Description |
|---|---|
Server Path |
Path on the remote broker to connect to, if applicable. |
Sub-protocol |
Sub-protocol set in the WebSocket handshake header (for example, MQTT5). |
Once all relevant settings are configured, select Create bridge (bottom left) to save the configuration and return to the Bridges page.
A confirmation notification appears when the bridge is successfully created.
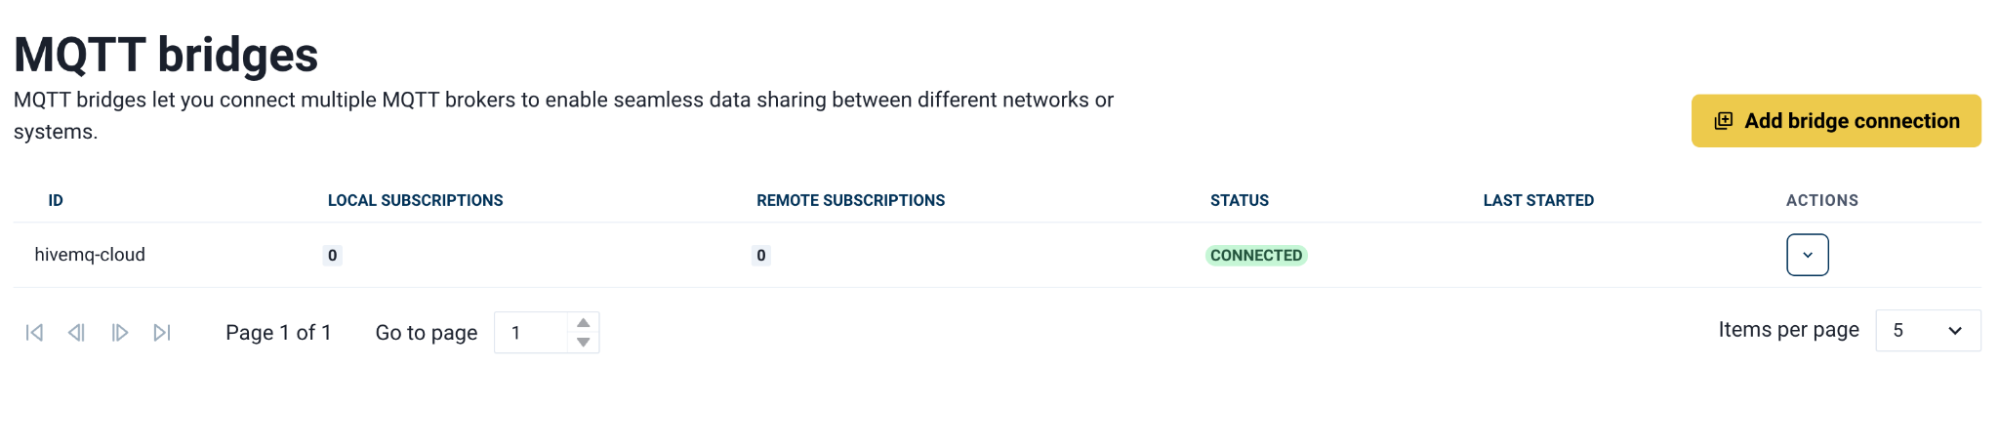
The bridge initially appears in the list as Disconnected. After a short time, the status updates to Connected.
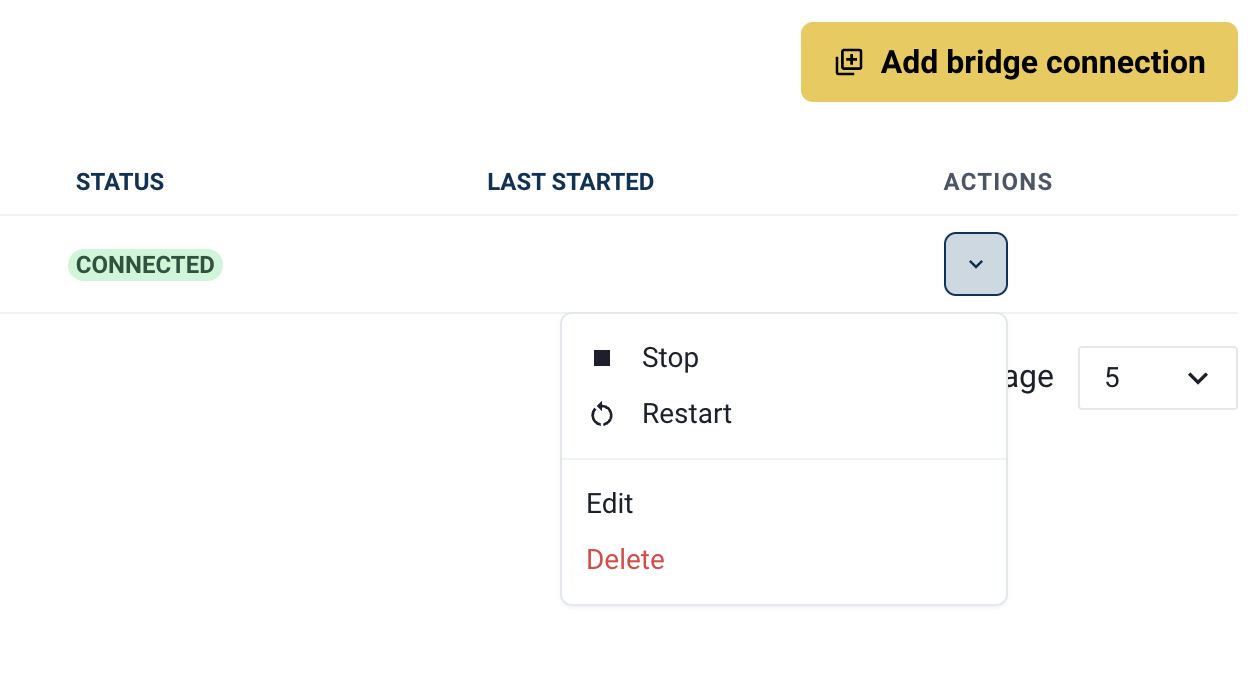
Each bridge in the list has a down arrow that exposes the following management options:
| Field | Description |
|---|---|
Stop |
Pauses publishing and subscribing while retaining the bridge configuration. |
Restart |
Forces the bridge to restart — useful if data flow has stalled or the bridge is in an error state. |
Edit |
Reopens the bridge configuration panel to make changes. |
Delete |
Permanently removes the bridge and its configuration from HiveMQ Edge. |
Protocol Adapters
Protocol Adapters are connections to sources from which you want to collect data at the edge. Typical sources include Operational Technology (OT) formats such as OPC-UA and ModBus.
Adapters can be created in two ways:
-
From the Protocol Adapters section in the main navigation menu with the Add New Adapter option in the top right.
-
With the self-guided Creation Wizard in the Workspace Toolbox.
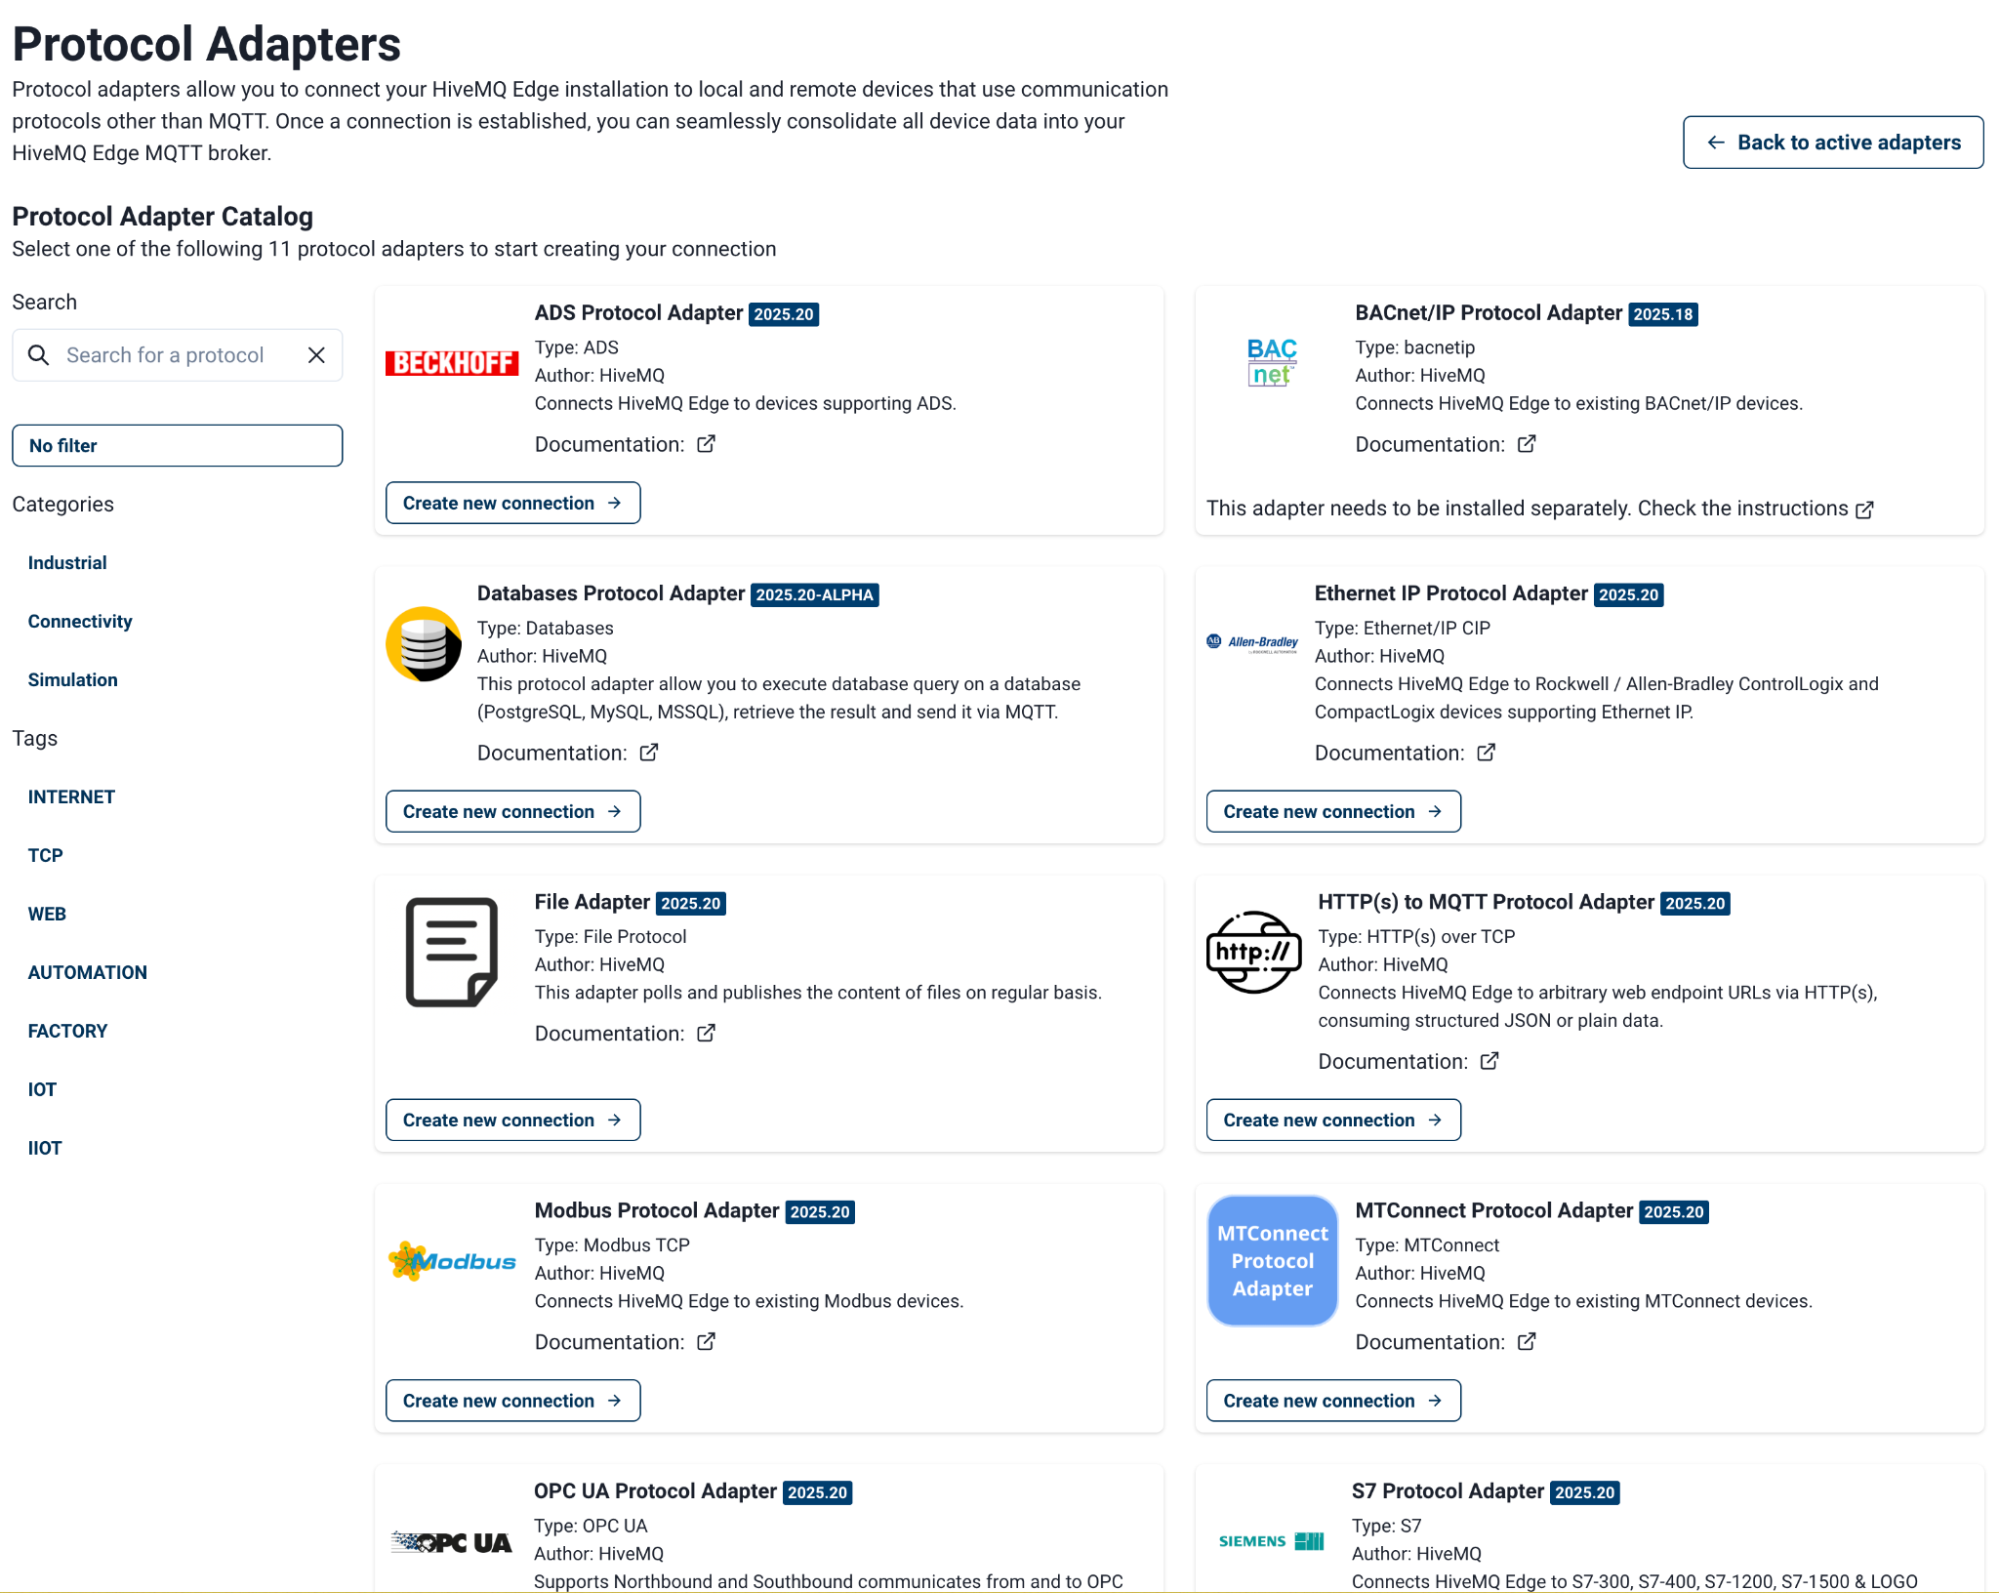
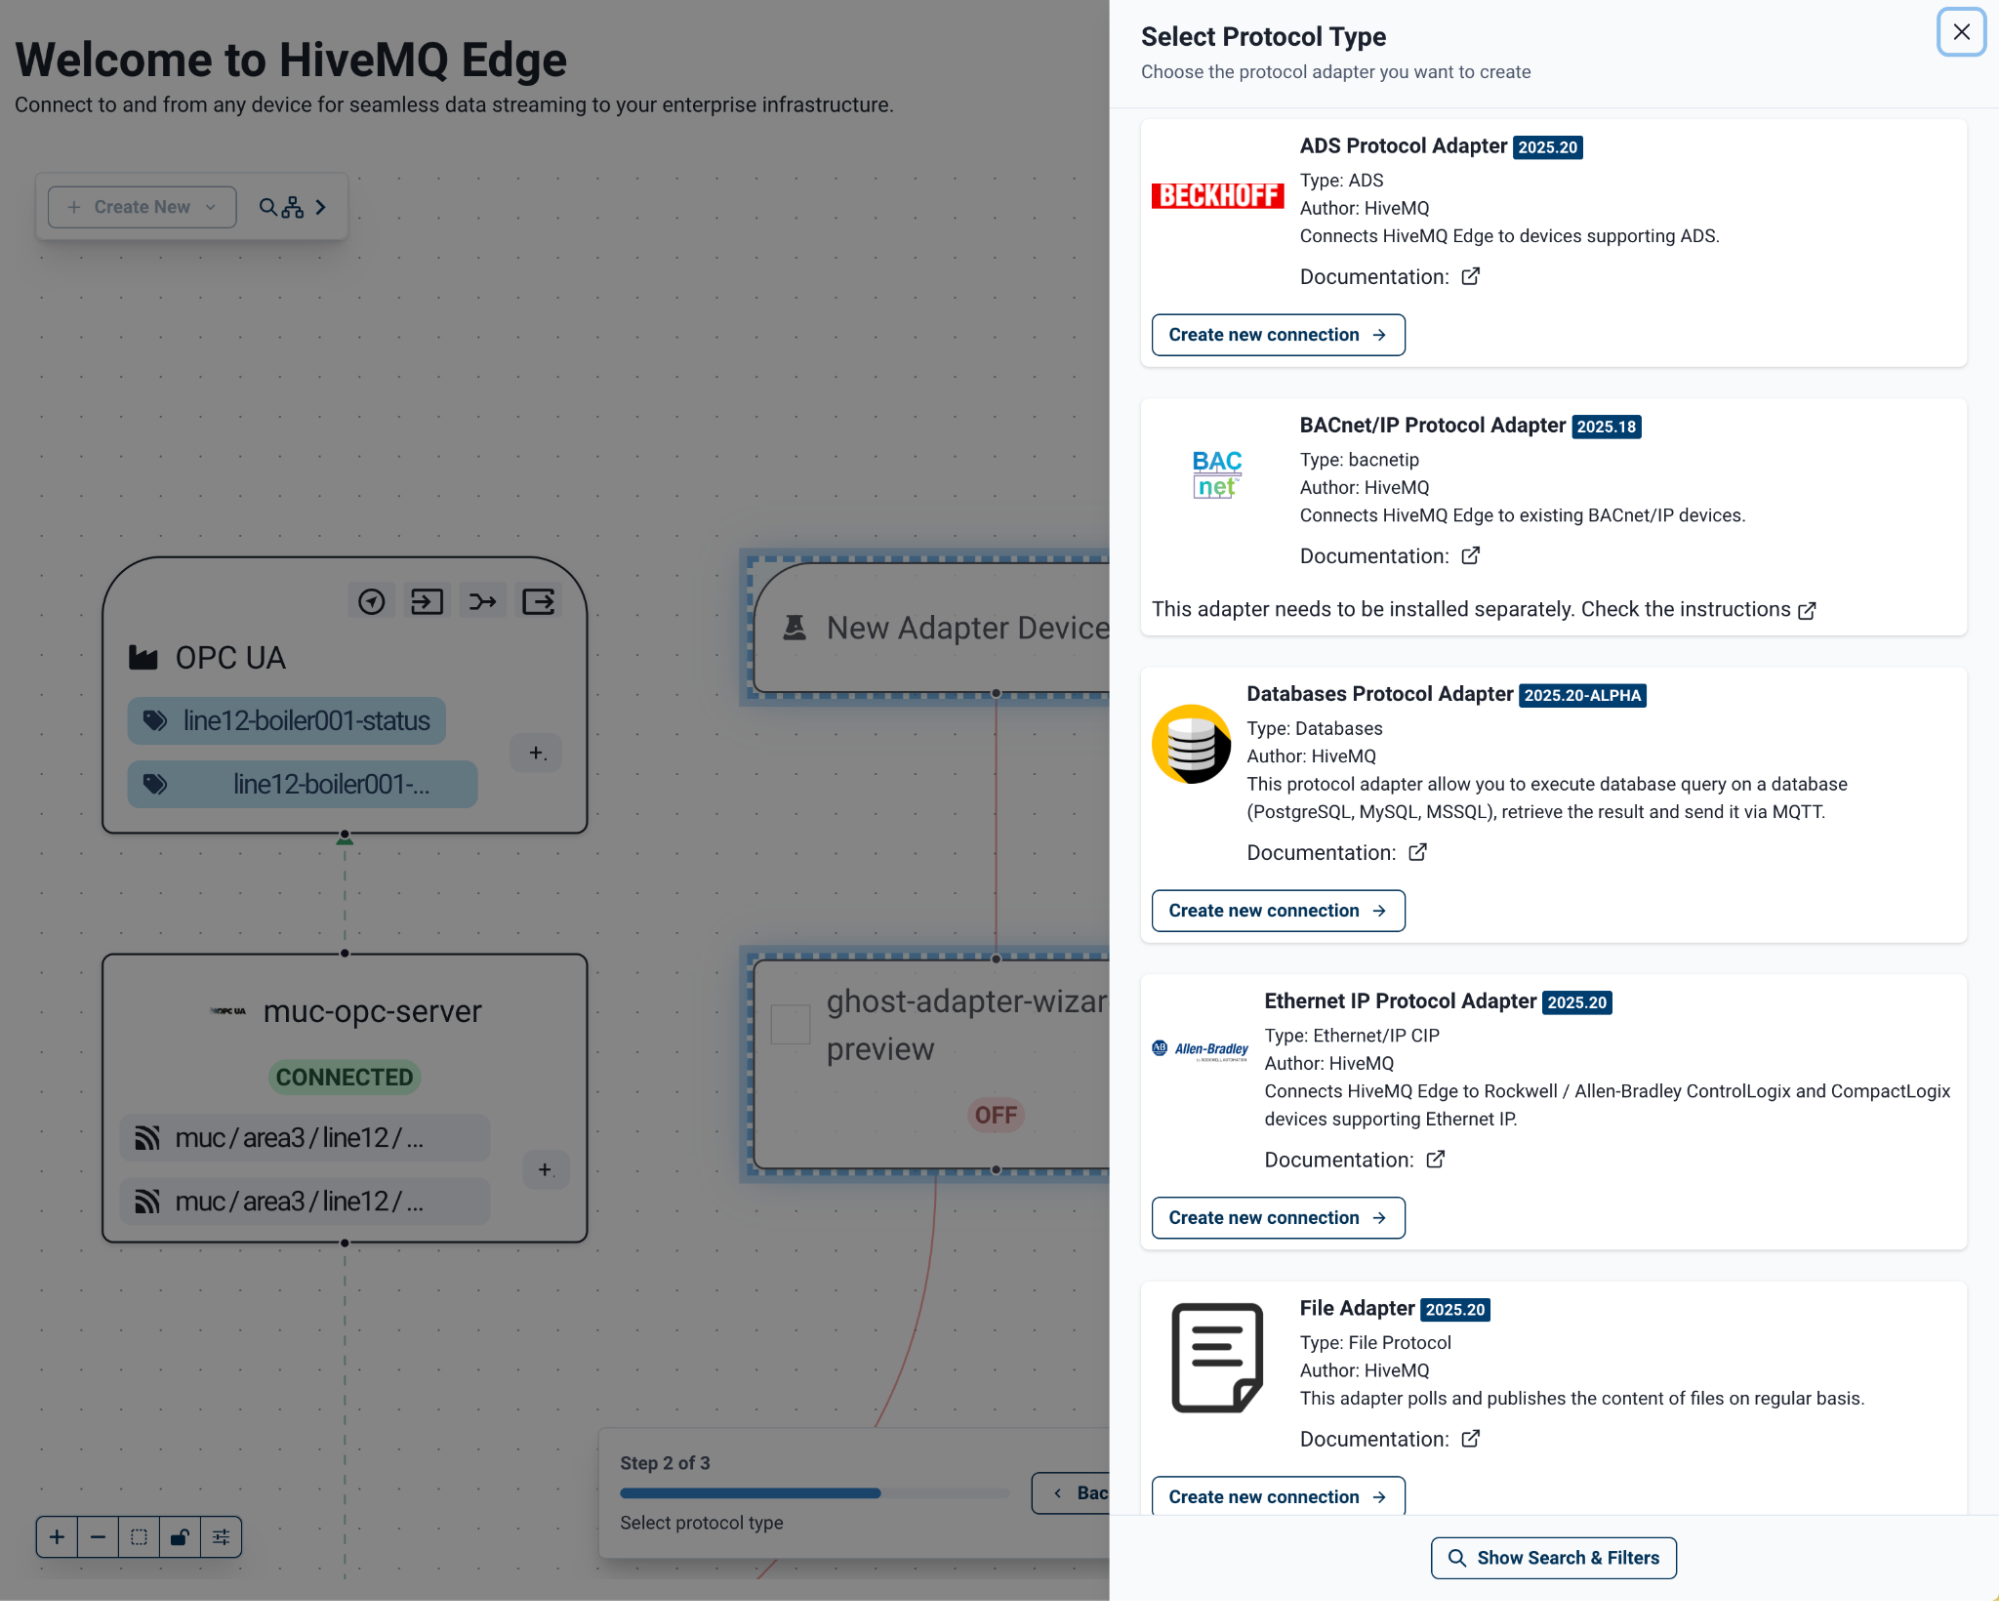
When you select Add New Adapter, a matrix view of all available adapter types opens. Use the search bar or browse by category and protocol type to find the adapter you need. Once your find the desired protocol, select Create new connection to open the configuration view and create a new adapter instance.
| The number of protocols supported can vary between Adapter versions. Earlier versions typically support fewer protocols. |
Some adapters, such as BACnet, are distributed separately due to licensing restrictions on their underlying libraries. These adapters can be installed separately and become available for configuration with a restart of HiveMQ Edge.
Configuration options for each adapter are not identical and are based on the protocol you choose. The available options for each adapter type are detailed in the following sections.
When you complete your configuration, select Create (bottom right) to create the adapter instance.
ADS (Beckhoff)
The ADS protocol adapter connects HiveMQ Edge to Beckhoff TwinCAT networks that use the Automation Device Specification (ADS) protocol.
Connection
| Field | Description |
|---|---|
Identifier |
User-defined unique identifier for the adapter instance. |
Host |
Address of the ADS device to which HiveMQ Edge connects. |
Port |
Port used for ADS traffic on the network. |
Keep Alive |
Keeps the connection active during periods of ADS traffic inactivity. |
ADS to MQTT
| Field | Default | Description |
|---|---|---|
Max. Polling Errors |
|
User-defined number of consecutive polling failures before the adapter stops. Set to -1 for unlimited retries. |
Polling Interval |
|
Time between polls, in milliseconds. |
Publish on Change |
— |
When enabled, data is only published if it has changed since the last poll. Disable to publish on every poll regardless of change. |
Keep Alive |
— |
Keeps the TCP connection open during periods of inactivity. |
ADS Device
| Field | Default | Description |
|---|---|---|
Source AMS Net ID |
— |
AMS Net ID of the HiveMQ Edge instance, used to identify Edge on the AMS network. |
Source AMS Port |
|
Port HiveMQ Edge uses to connect to the AMS network. |
Target AMS Net ID |
— |
AMS Net ID of the target ADS device. |
Target AMS Port |
— |
AMS port the target device uses to connect. |
Keep Alive |
— |
check box to keep the TCP connection open during periods of inactivity. |
BACnet
The BACnet/IP protocol adapter connects HiveMQ Edge to IP device networks that use the Building Automation Control network (BACnet) protocol.
Due to library licensing restrictions, the BACnet adapter requires a separate download from the HiveMQ Server.
Once downloaded, copy the .jar file to the modules folder in your HiveMQ Edge installation directory and restart Edge to activate it.
|
Settings
| Field | Default | Description |
|---|---|---|
Identifier |
— |
User-defined unique identifier for the adapter instance. |
Port |
|
Port used for BACnet traffic on the network. |
Device ID |
— |
User-defined ID for HiveMQ Edge on the BACnet network. |
Subnet Broadcast Address |
— |
BACnet network broadcast address to communicate over. |
Discovery Interval |
|
Time between scans for new devices on the network, in milliseconds. |
Host |
— |
IP address or hostname of the BACnet device with which HiveMQ Edge communicates. |
BACnet/IP to MQTT
| Field | Default | Description |
|---|---|---|
Max. Polling Errors |
|
Number of consecutive polling failures before the adapter stops. Set to |
Polling Interval |
|
Time between polls, in milliseconds. |
Publish on change |
On |
When enabled, data is only published if it has changed since the last poll. Disable to publish on every poll regardless of change. |
Databases
The Databases protocol adapter connects HiveMQ Edge to SQL databases for ingestion of static data into HiveMQ Edge.
Settings
| Field | Default | Description |
|---|---|---|
Identifier |
— |
user-defined unique identifier for the adapter instance. |
Type |
— |
Database protocol (select from the dropdown list). |
Server |
— |
Server address where the database is hosted. |
Port |
— |
Port address to access the database. |
Database |
— |
Name of the database to which HiveMQ Edge connects. |
Username |
— |
Database access username. |
Password |
— |
Database access password. |
Encrypt |
— |
Enable the use of a TLS connection. |
Trust Certificate |
— |
Enable HiveMQ Edge to trust the certificate of the database server. |
Connection Timeout |
|
Duration of inactivity before the connection times out, in seconds. |
Publishing
| Field | Default | Description |
|---|---|---|
Polling Interval |
— |
How often the adapter polls the database, in milliseconds. |
Max. Polling Errors |
|
Number of consecutive polling failures before the adapter stops. Set to -1 for unlimited retries. |
Encrypt |
— |
Enable the use of a TLS connection. |
Trust Certificate |
— |
Enable HiveMQ Edge to utilize the trust certificate of the database. |
Timeout |
— |
User-defined automatic disconnection from the database, in seconds. |
Ethernet/IP (Rockwell / Allen-Bradley)
The Ethernet/IP (EIP) protocol adapter connects HiveMQ Edge to Rockwell and Allen-Bradley PLCs, as well as other devices that support the Ethernet/IP protocol.
Connection
| Field | Default | Description |
|---|---|---|
Identifier |
— |
User-defined unique identifier for the adapter instance. |
Host |
— |
Address of the Ethernet/IP device to which HiveMQ Edge connects. |
Port |
|
Port used for Ethernet/IP traffic on the network. |
EIP to MQTT
| Field | Default | Description |
|---|---|---|
Max. Polling Errors |
|
User-defined number of consecutive polling failures before the adapter stops. Set to |
Polling Interval |
|
Time between polls, in milliseconds. |
Publish on change |
On |
When enabled, data is only published if it has changed since the last poll. Disable to publish on every poll regardless of change. |
File
The File adapter ingests the contents of locally accessible files into MQTT payloads.
HTTP(S) to MQTT
The HTTP adapter connects HiveMQ Edge to external HTTP sources and captures the returned data into MQTT payloads.
Connection
| Field | Default | Description |
|---|---|---|
Identifier |
— |
User-defined unique identifier for the adapter instance. |
Allow Untrusted Certificates |
— |
Enables the adapter to allow connections to hosts with untrusted or self-signed TLS certificates. |
HTTP Connection Timeout |
|
User-defined maximum time in seconds the adapter waits when attempting to establish a connection. |
HTTP to MQTT
| Field | Default | Description |
|---|---|---|
Max. Polling Errors |
|
User-defined number of consecutive polling failures before the adapter stops. Set to |
Polling Interval |
|
Time between polls, in milliseconds. |
Assert JSON Response |
— |
Enables the adapter to attempt parsing a JSON response even if the HTTP response content type is not JSON. |
Publish on Success |
On |
When enabled, data is only published for successful HTTP response codes. Disable to publish regardless of the response code returned. |
ModBus
The Modbus protocol adapter connects HiveMQ Edge to Modbus devices and servers to enable polling of data stored in registers and arrays.
Connection
| Field | Default | Description |
|---|---|---|
Identifier |
— |
User-defined unique identifier for the adapter instance. |
Host |
— |
Address of the Modbus device or server to which HiveMQ Edge connects. |
Port |
— |
Port used for Modbus traffic on the network. |
Timeout |
|
Time the adapter waits for a connection, in milliseconds. |
ModBus to MQTT
| Field | Default | Description |
|---|---|---|
Max. Polling Errors |
|
User-defined number of consecutive polling failures before the adapter stops. Set to |
Polling Interval |
|
Time between polls, in milliseconds. |
Publish on change |
On |
When enabled, data is only published if it has changed since the last poll. Disable to publish on every poll regardless of change. |
MTConnect
The MTConnect protocol adapter connects HiveMQ Edge to CNC controller agents that support the MTConnect or Mitsubishi Connect protocol.
Connection
| Field | Default | Description |
|---|---|---|
Identifier |
— |
User-defined unique identifier for the adapter instance. |
Allow Untrusted Certificates |
— |
Enable the adapter to allow connections to hosts with untrusted or self-signed TLS certificates. |
HTTP Connection Timeout |
|
Maximum time in seconds the adapter waits when attempting to establish a connection. |
Max. Polling Errors |
|
User-defined number of consecutive polling failures before the adapter stops. Set to |
Polling Interval |
|
Time between polls, in milliseconds. |
OPC-UA
The OPC-UA protocol adapter connects HiveMQ Edge to OPC-UA servers to enable the discovery and capture of values from OPC-UA server nodes.
Connection
| Field | Default | Description |
|---|---|---|
Identifier |
— |
User-defined unique identifier for the adapter instance. |
OPC UA URI |
— |
Address of the OPC-UA server to which HiveMQ Edge connects. |
Override Server Returned Endpoint |
— |
Enable to override the endpoint URI with the hostname and port returned by the server. |
Application URI Override |
— |
User-specified URI used by HiveMQ Edge to identify itself to the server. If left empty, Edge uses the URI from the certificate SAN extension, or |
Message Security Configuration
| Field | Description |
|---|---|
OPC UA Security Policy |
Security policy to apply to the connection, if applicable. |
Message Security Mode |
Security mode for messages. Possible values are |
TLS Configuration
| Field | Description |
|---|---|
Enable TLS |
Enable to use a TLS connection to the OPC-UA server. |
Certificate Validation |
Select validation level applied to the TLS connection. |
Keystore
| Field | Description |
|---|---|
Keystore Path |
File path of the keystore to use. |
Keystore Password |
Password for the keystore, if applicable. |
Private Key Password |
Password for the private key. |
Truststore
| Field | Description |
|---|---|
Truststore Path |
File path to the truststore to be used, if applicable. |
Truststore Password |
Password for the truststore. |
Authentication Configuration
Basic Authentication
| Field | Description |
|---|---|
Username |
OPC-UA server access username. |
Password |
OPC-UA server access password. |
X.509 Authentication
| Field | Description |
|---|---|
Enable X.509 |
Enable to use X.509 certificate-based authentication for the server connection. |
OPC UA to MQTT
| Field | Default | Description |
|---|---|---|
OPC UA Publishing Interval |
|
Interval at which the OPC-UA subscription publishes messages, in milliseconds. |
OPC UA Queue Size |
|
Message queue size for the subscription to the server. |
Connection Options
| Field | Default | Description |
|---|---|---|
Automatic Reconnection |
On |
When enabled, the adapter automatically attempts to reconnect after a connection loss. Disable to manage reconnection manually. |
Reconnect on Service Fault |
On |
When enabled, the adapter automatically reconnects when critical OPC-UA service faults occur (for example, session invalid or subscription lost). Disable to suppress automatic reconnection on faults. |
Session Timeout |
|
Duration before the session is renewed, in milliseconds. |
Connection Timeout |
|
Maximum time the adapter waits when attempting to establish a connection, in milliseconds. |
Connection Retry Interval |
|
User-defined time to wait between connection retry attempts, in milliseconds. |
Request Timeout |
|
User-defined timeout for OPC UA requests. |
Keep-Alive Interval |
|
User-defined time between keep-alive pings. |
Keep-Alive Failures Allowed |
|
Number of missed keep-alive pings before the connection is considered lost. |
Healthcheck Interval |
|
How often the adapter performs a connection health check, in milliseconds. |
Siemens S7
The Siemens S7 protocol adapter connects HiveMQ Edge to Siemens STEP 7-compatible devices that use the Siemens S7 proprietary protocol.
Connection
| Field | Default | Description |
|---|---|---|
Identifier |
— |
User-defined unique identifier for the adapter instance. |
Host |
— |
Address of the S7 device or server to which HiveMQ Edge connects. |
Port |
|
Port used for S7 traffic on the network. |
Keep-Alive |
— |
Enable to send keep-alive pings and prevent TCP connection timeouts during long polling intervals. |
S7 to MQTT
| Field | Default | Description |
|---|---|---|
Max. Polling Errors |
|
User-defined number of consecutive polling failures before the adapter stops. Set to |
Polling Interval |
|
Time between polls, in milliseconds. |
Publish on change |
On |
When enabled, data is only published if it has changed since the last poll. Disable to publish on every poll regardless of change. |
S7 Device
| Field | Description |
|---|---|
S7 Controller Type |
The type of device to which the adapter connects. |
Remote Rack |
Rack location of the primary Communication Processor (CPU module). |
Remote Rack 2 |
Rack location of the secondary Communication Processor (CPU module). |
Remote Slot |
Slot location of the primary Communication Processor (CPU module). |
Remote Slot 2 |
Slot location of the secondary Communication Processor (CPU module) |
Remote TSAP |
Transport Services Access Point (TSAP) address for additional addressing. Typically only required for devices in the LOGO series. |
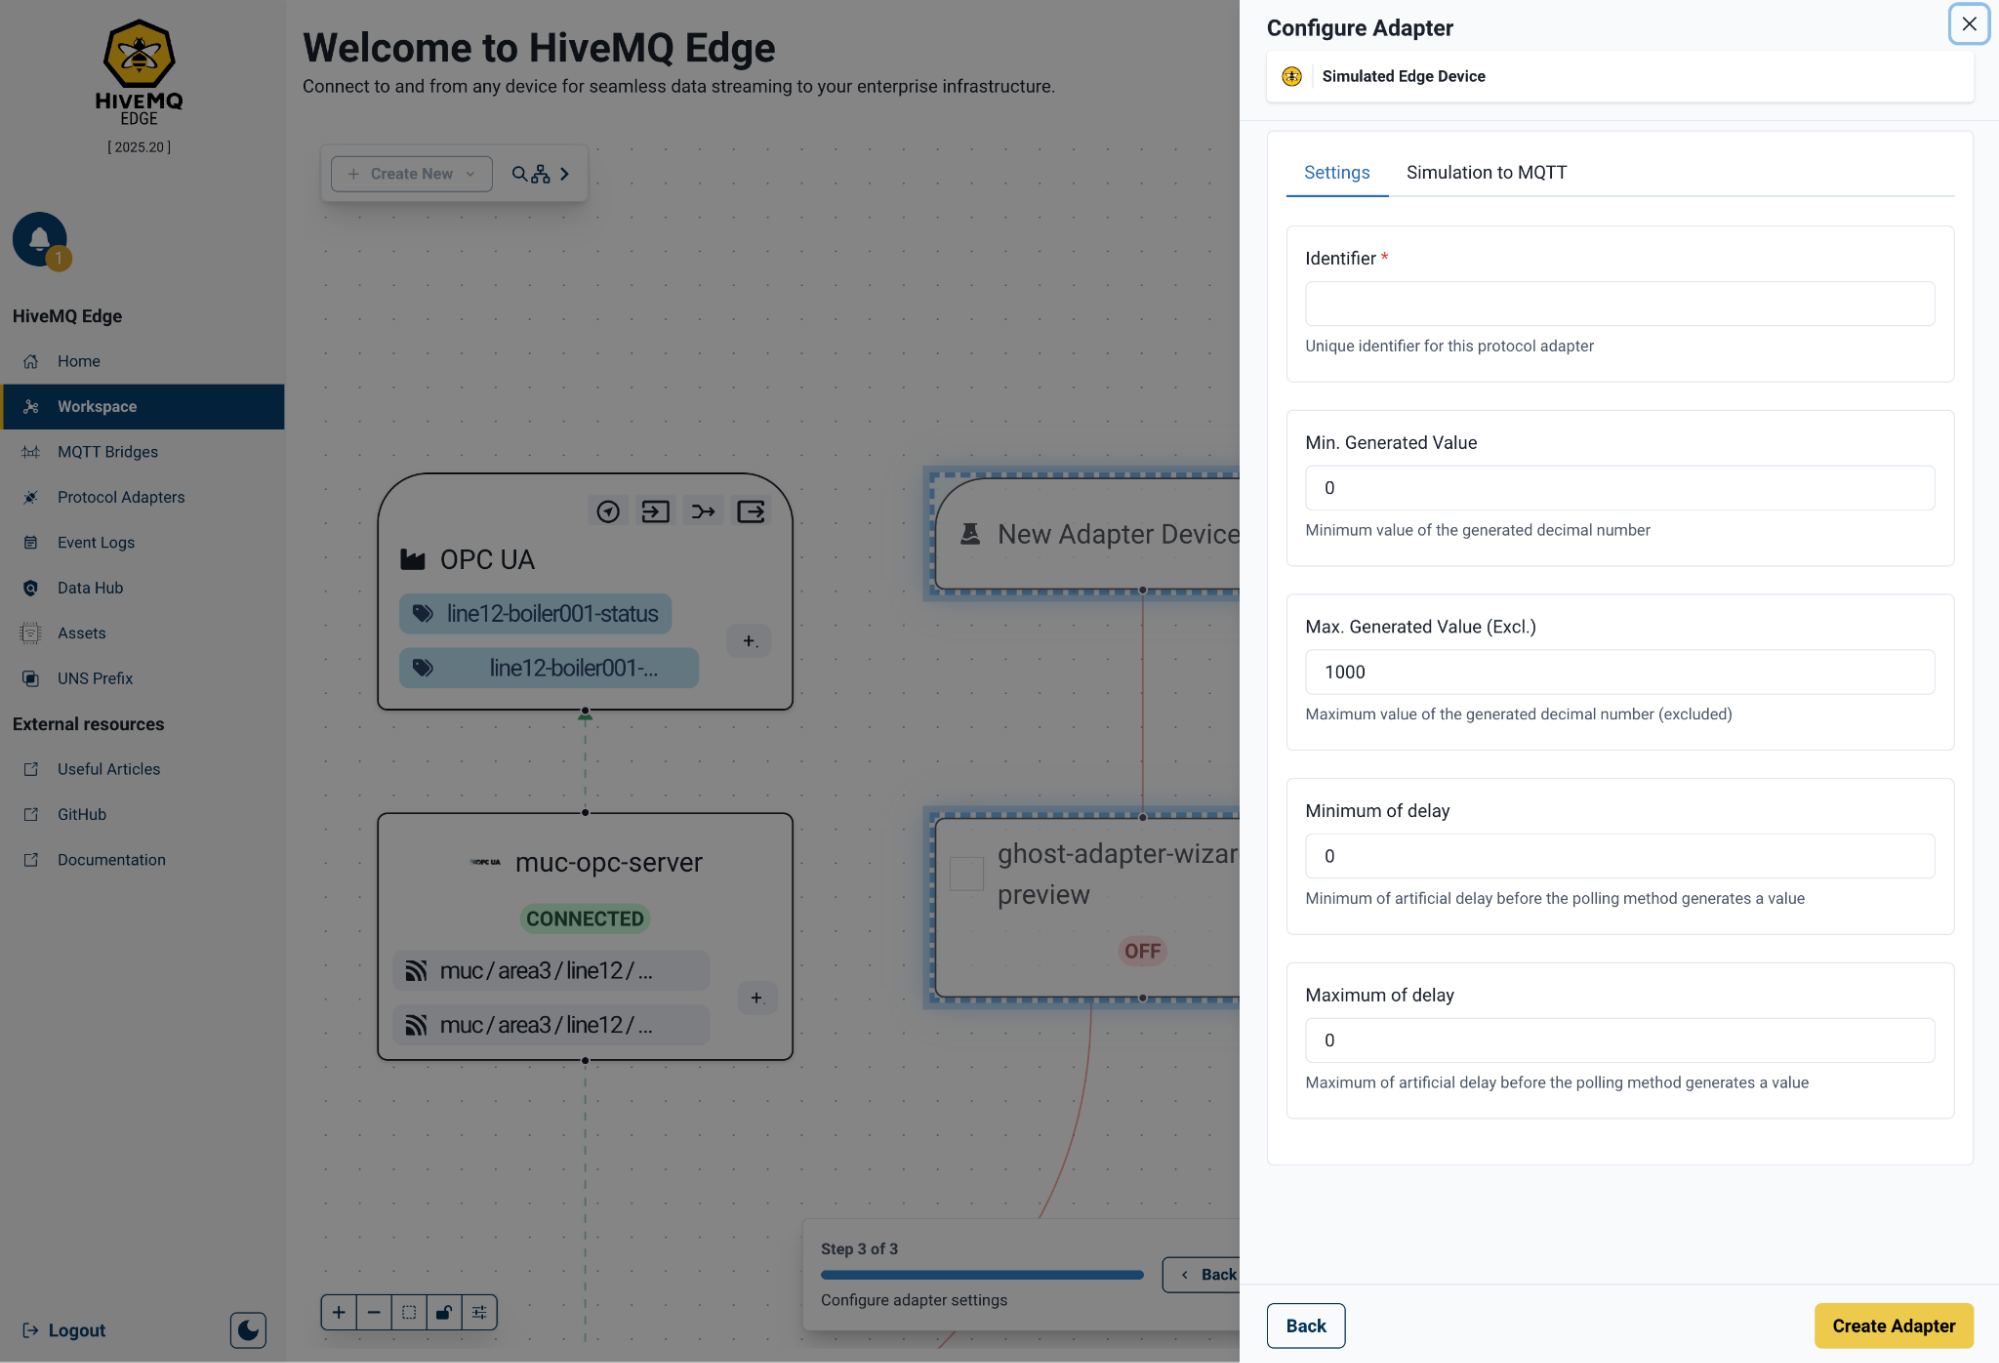
Simulation
The Simulation adapter generates synthetic OT data within HiveMQ Edge that allows you to test architectures and data flows without a physical data source.
Settings
| Field | Default | Description |
|---|---|---|
Identifier |
— |
User-defined unique identifier for the adapter instance. |
Min. Generated Value |
|
User-defined minimum integer value the adapter can generate. |
Max. Generated Value |
|
User-defined maximum integer value the adapter can generate. |
Minimum of Delay |
|
Minimum delay between simulated publishes to MQTT, in seconds. |
Maximum of Delay |
|
Maximum delay between simulated publishes to MQTT, in seconds. |
Event Log
The Event Log provides a runtime list of events that occur within HiveMQ Edge. The log is accessible from the Event Logs item in the main navigation menu.
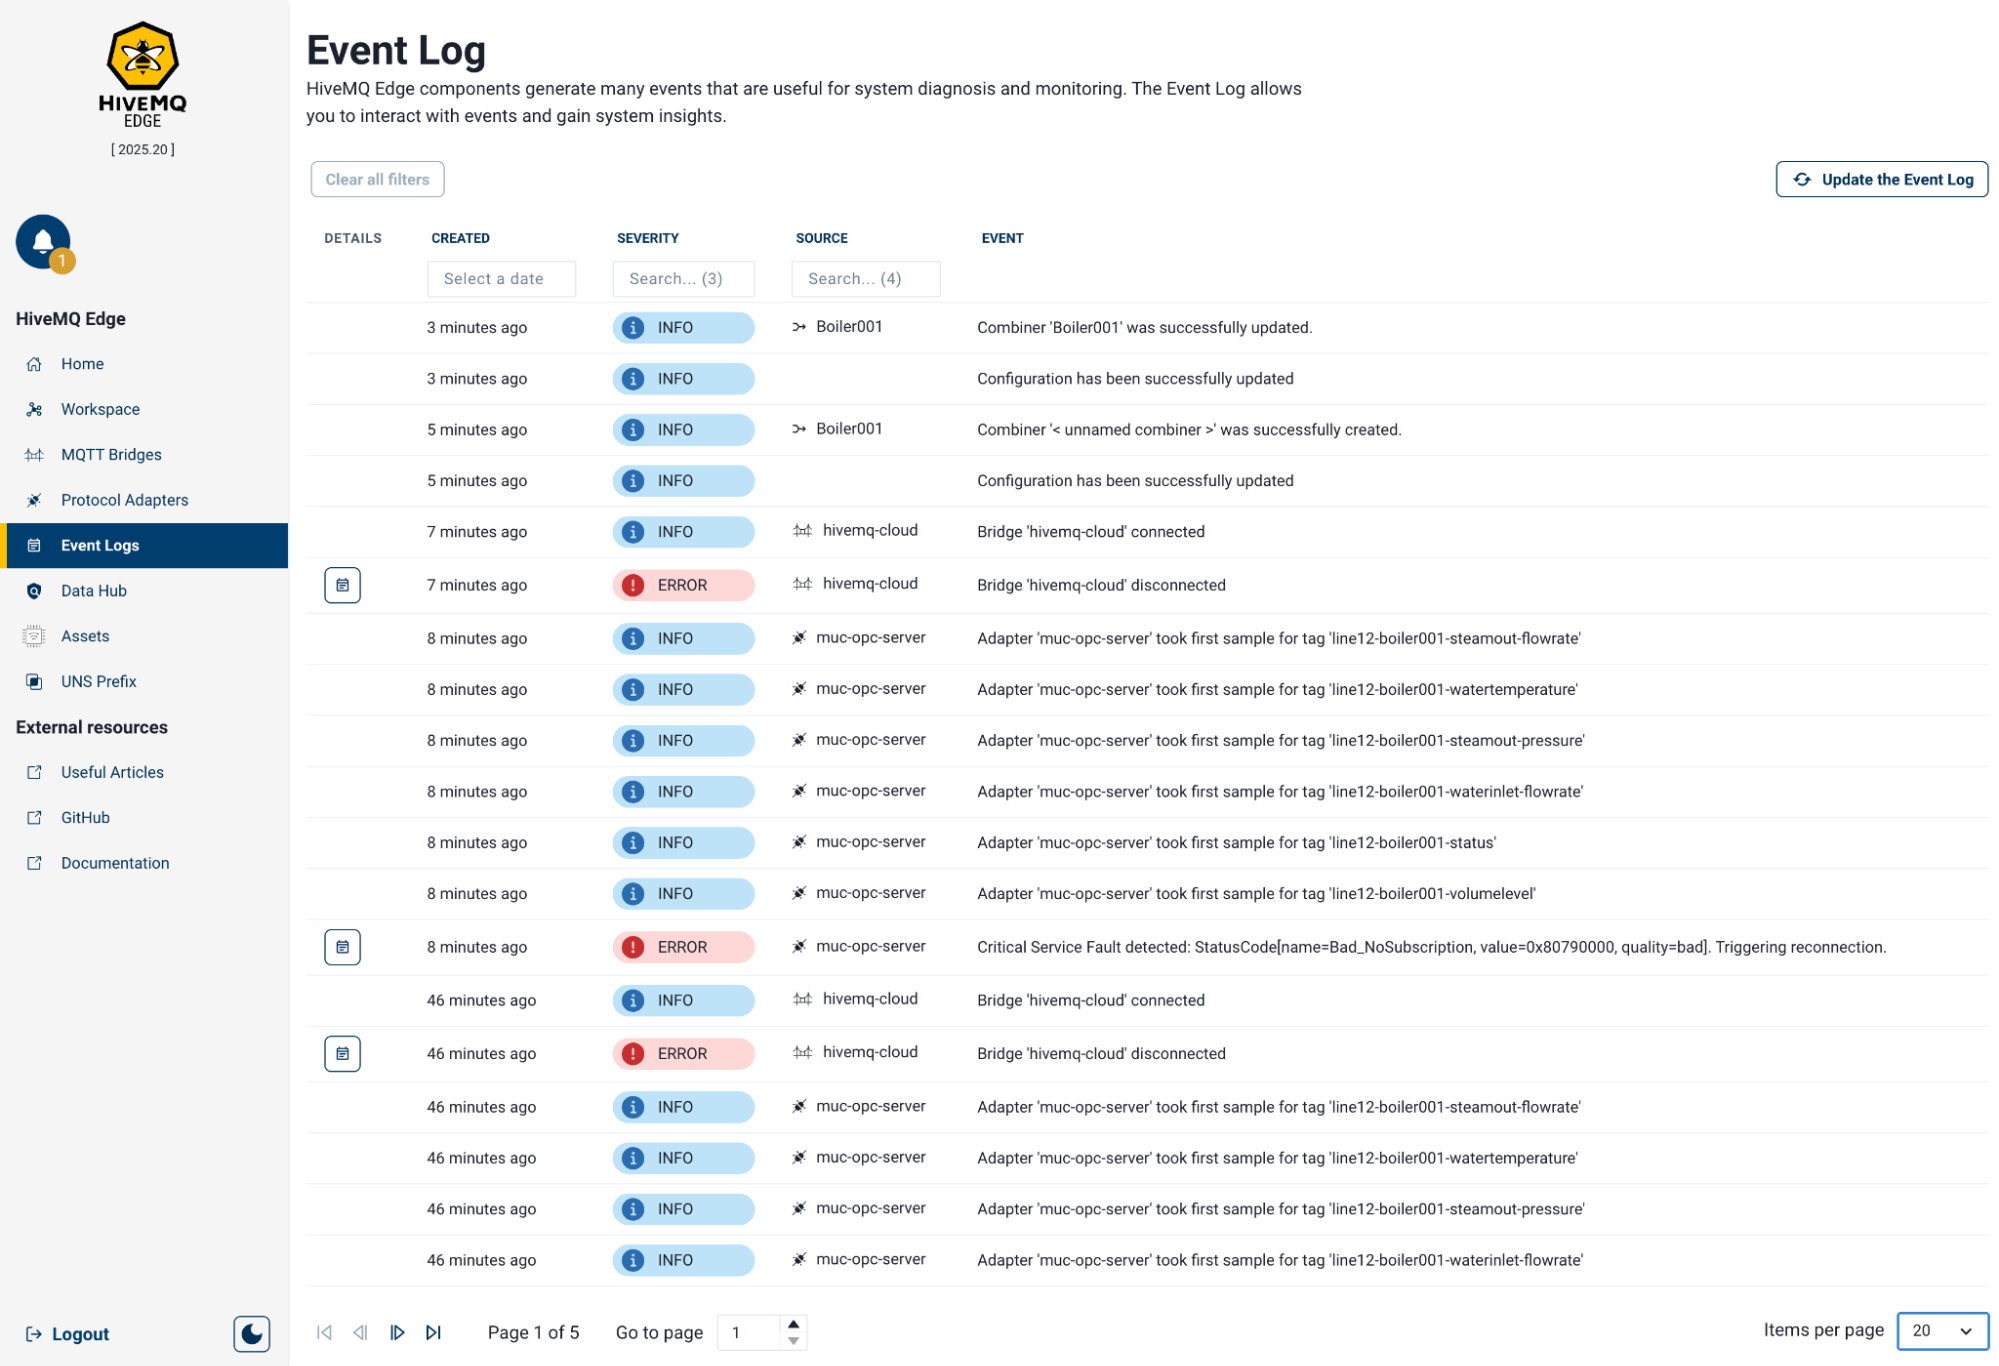
The Event Log lists items across five columns:
| Column | Description |
|---|---|
Details |
Where available, select the icon to expand additional details for the event. |
Created |
Time elapsed since the event occurred, rounded to minutes. Hover over the value to see the full timestamp. |
Severity |
Visual indicator of event impact ( |
Source |
The component within HiveMQ Edge where the event originated. Linked sources navigate to the configuration page of the component. |
Event |
Description of the event. |
The Event Log is searchable and filterable. Use the input fields above the Date, Severity, and Source columns to filter the list. To clear active filters, select the clear button above the event list.
Use the pagination controls at the bottom of the view to move between pages and set the number of items displayed per page. To reload the log with the latest events, select the Refresh button in the top right corner.
Data Hub on Edge
Data Hub within the HiveMQ Edge Console includes a visual policy designer. To access the designer, select Data Hub from the main navigation menu.
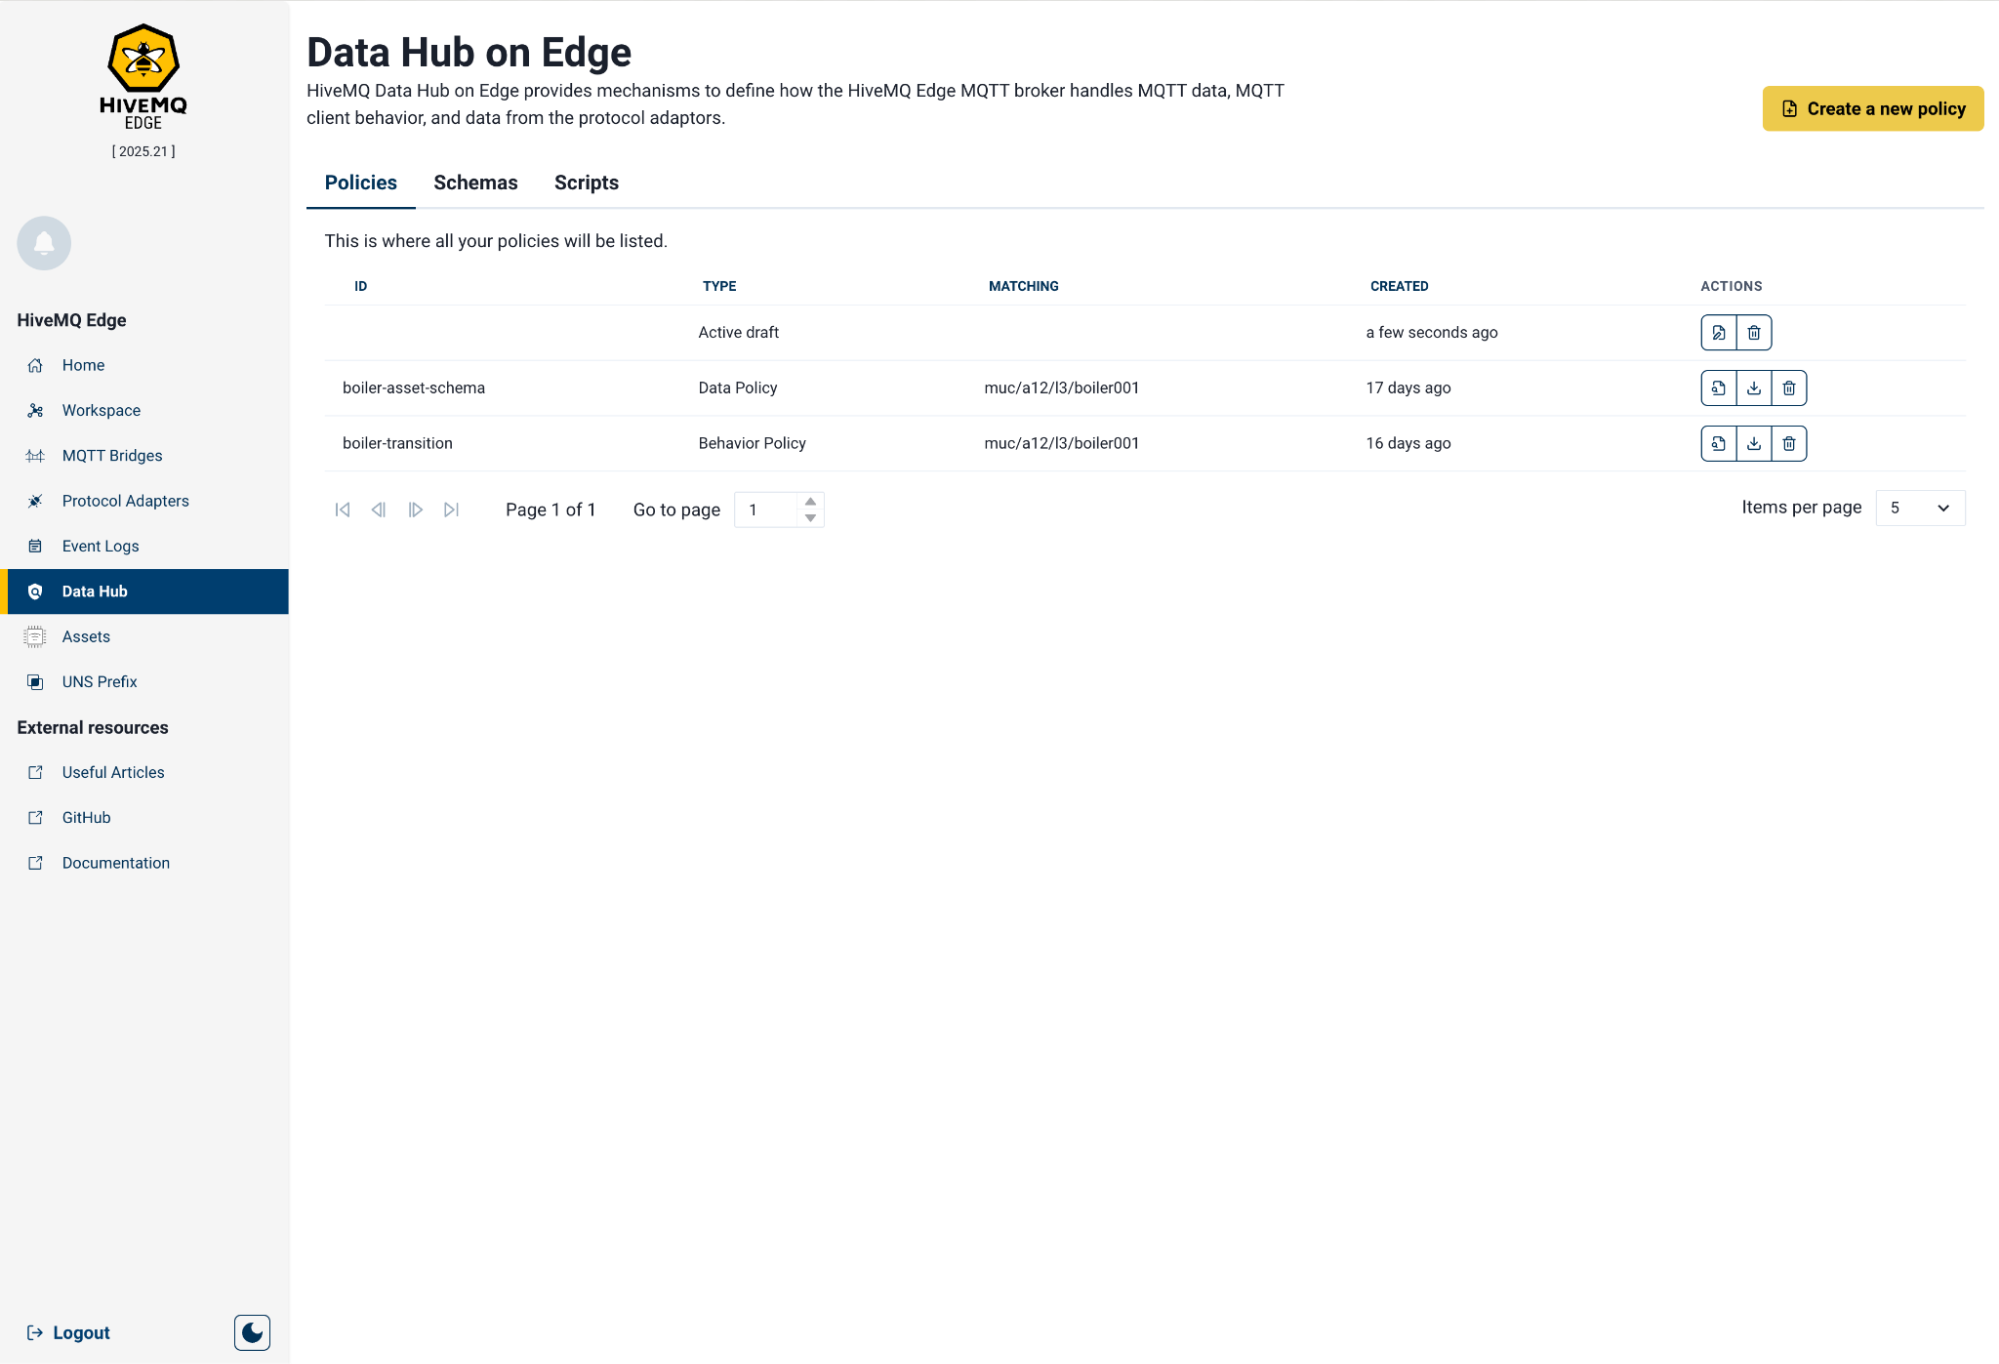
The main view displays three tabs: Policies, Schemas and Scripts. Each tab shows a paginated list of items, with navigation controls and a page size selector at the bottom.
List items in each tab support the following actions:
-
View/Edit: Opens an existing policy schema, or script to view or edit as required.
-
Download: Downloads the item to the local file system.
-
Delete: Permanently removes the item.
In the Policies tab, the Active draft displays at the top of the list. The Active draft is always a policy draft that you started but have not yet validated and published. You have the options to Continue on Draft or Delete this item if required.
Policies
To create a new policy users need to ensure they’re in the Policies tab under Data Hub in HiveMQ Edge, then click the corresponding yellow button in the top right corner of the view.
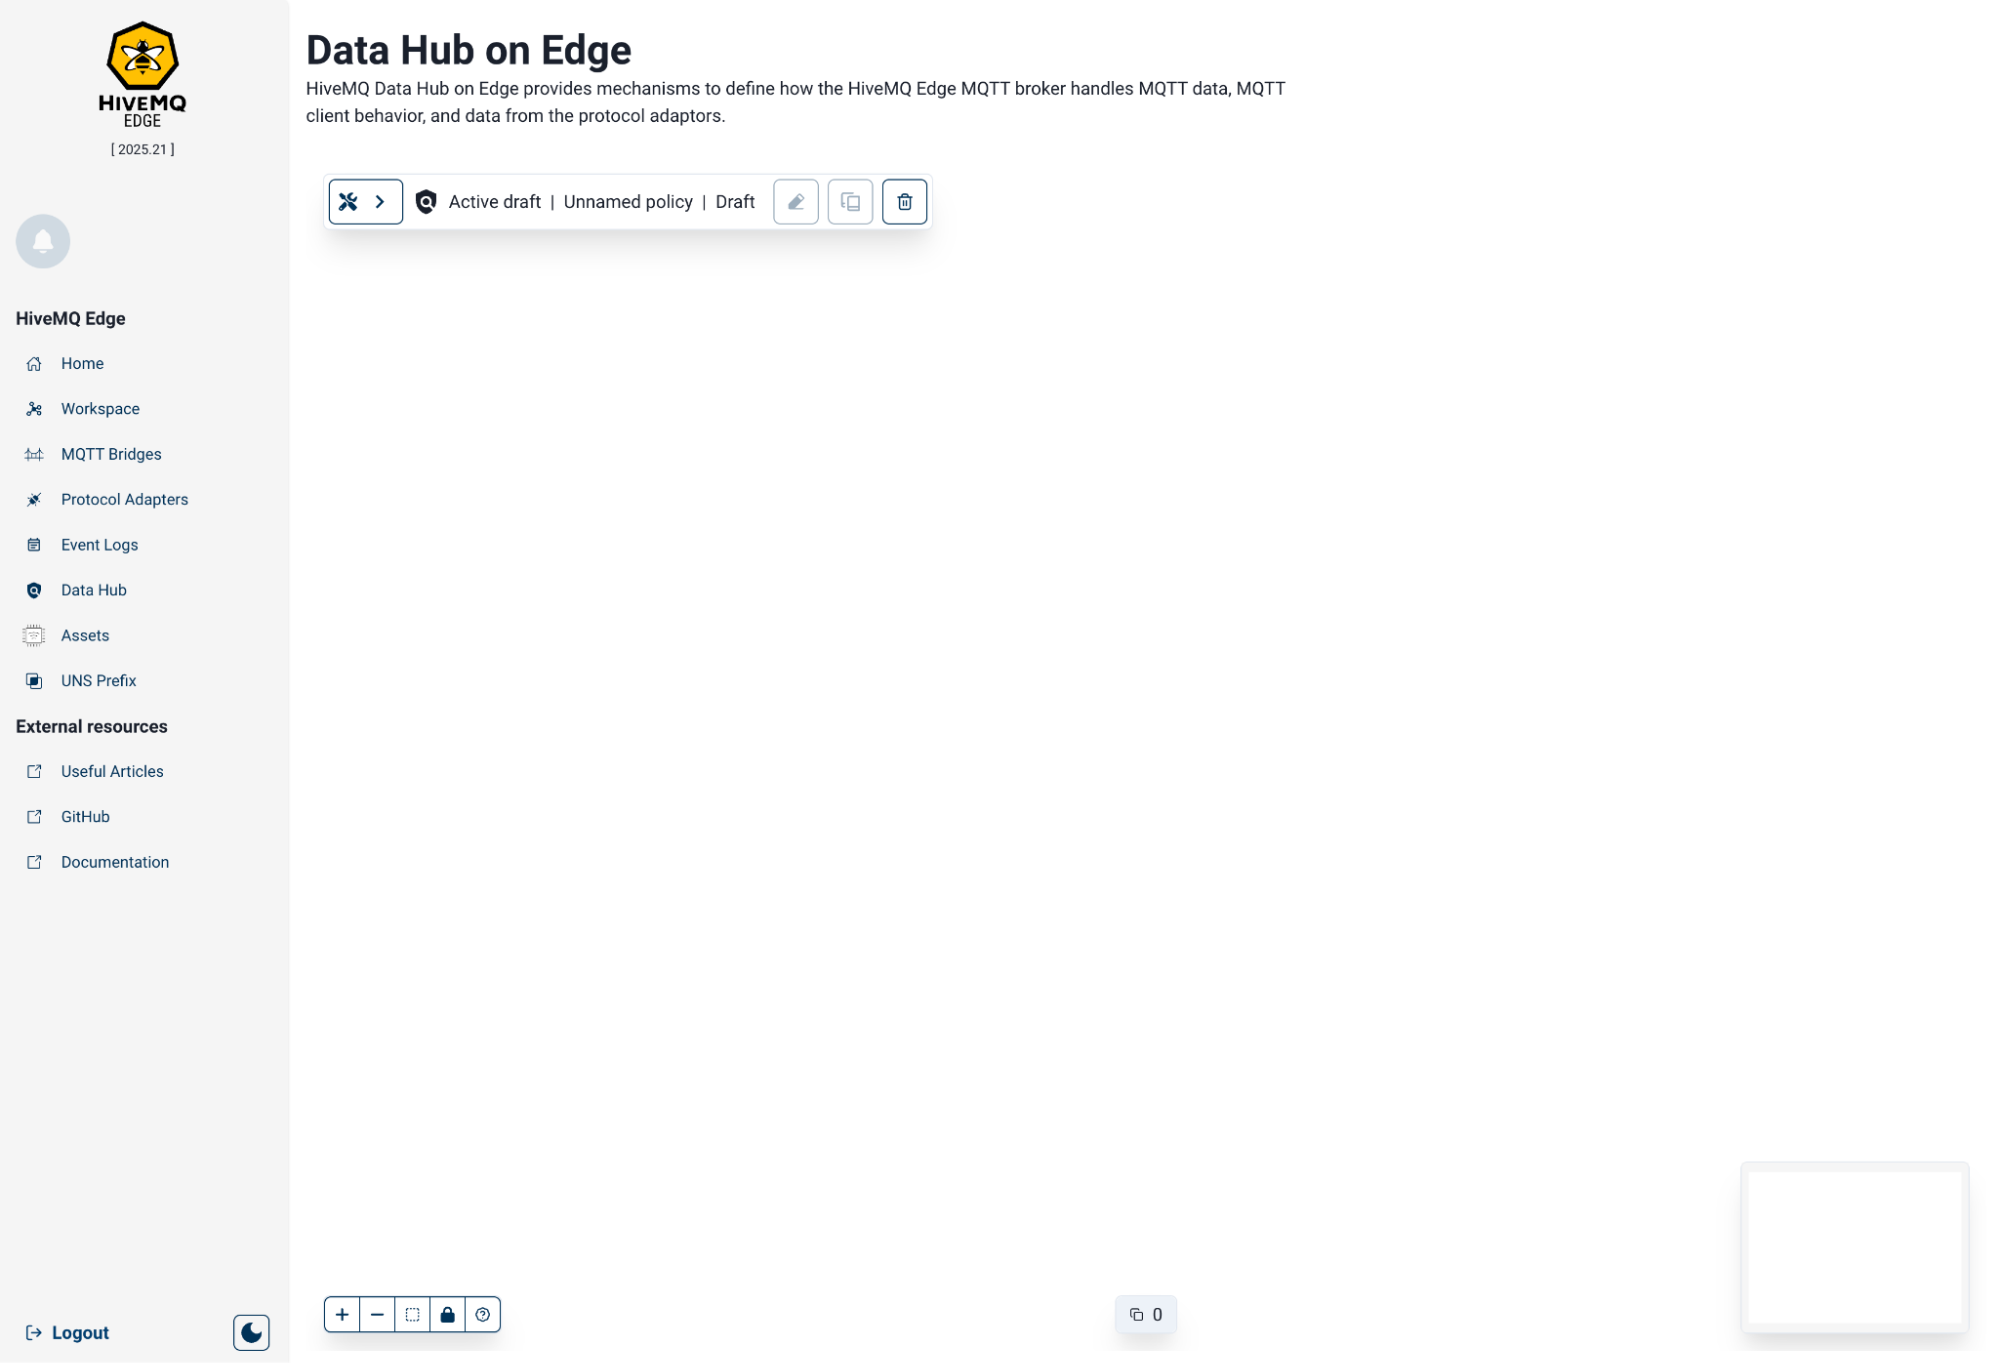
The initial view is blank and has three floating elements:
| Element | Location | Description |
|---|---|---|
Menu bar |
Top left |
Primary menu for the policy designer |
Canvas toolbar |
Bottom left |
Controls for configuring the canvas view. |
Mini map |
Bottom right |
Navigation aid for large policy canvases. |
Policy Designer Tools
Menu Bar
The menu bar provides the following policy management options:
| Option | Icon | Description |
|---|---|---|
Policy Toolbox |
Tools |
Opens the Policy Toolbox panel. |
Policy Status |
Shield |
Displays the current policy state and name, if defined. |
Modify the Policy |
Pencil |
Unlocks editing mode for an existing policy. |
Clone as a New Draft |
Copy |
Duplicates the current policy into a new designer instance for editing. |
Clear the Designer |
Trash |
Clears the canvas and resets the designer. |
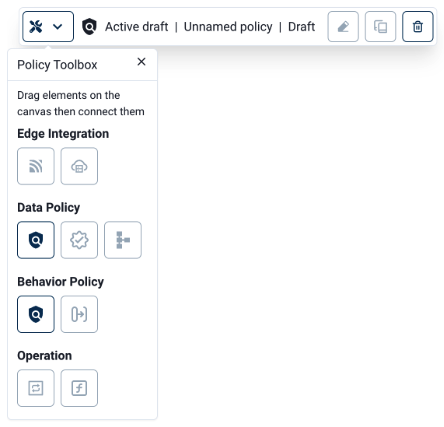
Policy Toolbox
Access the Policy Toolbox via the Menu Bar. The Policy Toolbox provides policy elements that you can drag to the canvas to build a Data Hub policy workflow. These elements are:
-
Edge Integration
-
Topic Filter (MQTT), enables users to select a topic for input into the policy
-
Client filter (database), enables users to select non-MQTT filters for input into the policy
-
-
Data Policy
-
Data Policy (shield): Drag this onto the canvas first to start building a Data Policy
-
Policy Validator (tick), used to pre-validate data before publishing
-
Schema (blocks), enables user schema upload and creation
-
-
Behavior Policy
-
Behavior Policy (shield): Drag this onto the canvas first to start building a Behavior Policy
-
Transition (move right), enables users to select predefined transitions for Behavior Policies
-
-
Operation
-
Operation (rotation), enables users to set a pre-defined operation to data
-
JS Function (f), enables user JS script upload or creation
-
Canvas Toolbar

The Canvas Toolbar offers the following options:
| Option | Icon | Description |
|---|---|---|
Zoom in |
|
Increases magnification on a specific area of the canvas. |
Zoom out |
|
Decreases magnification on a specific area on the canvas. |
Fit to the canvas |
Dotted box |
Centers all nodes within the canvas window. |
Lock the canvas |
Padlock |
Prevents nodes from moving while navigating or selecting. |
Help using the Designer |
|
Displays an overlay of available keyboard shortcuts. |
Policy Nodes
The Policy Designer lets you drag, connect, and configure functional nodes on the canvas to build a Data Hub policy.
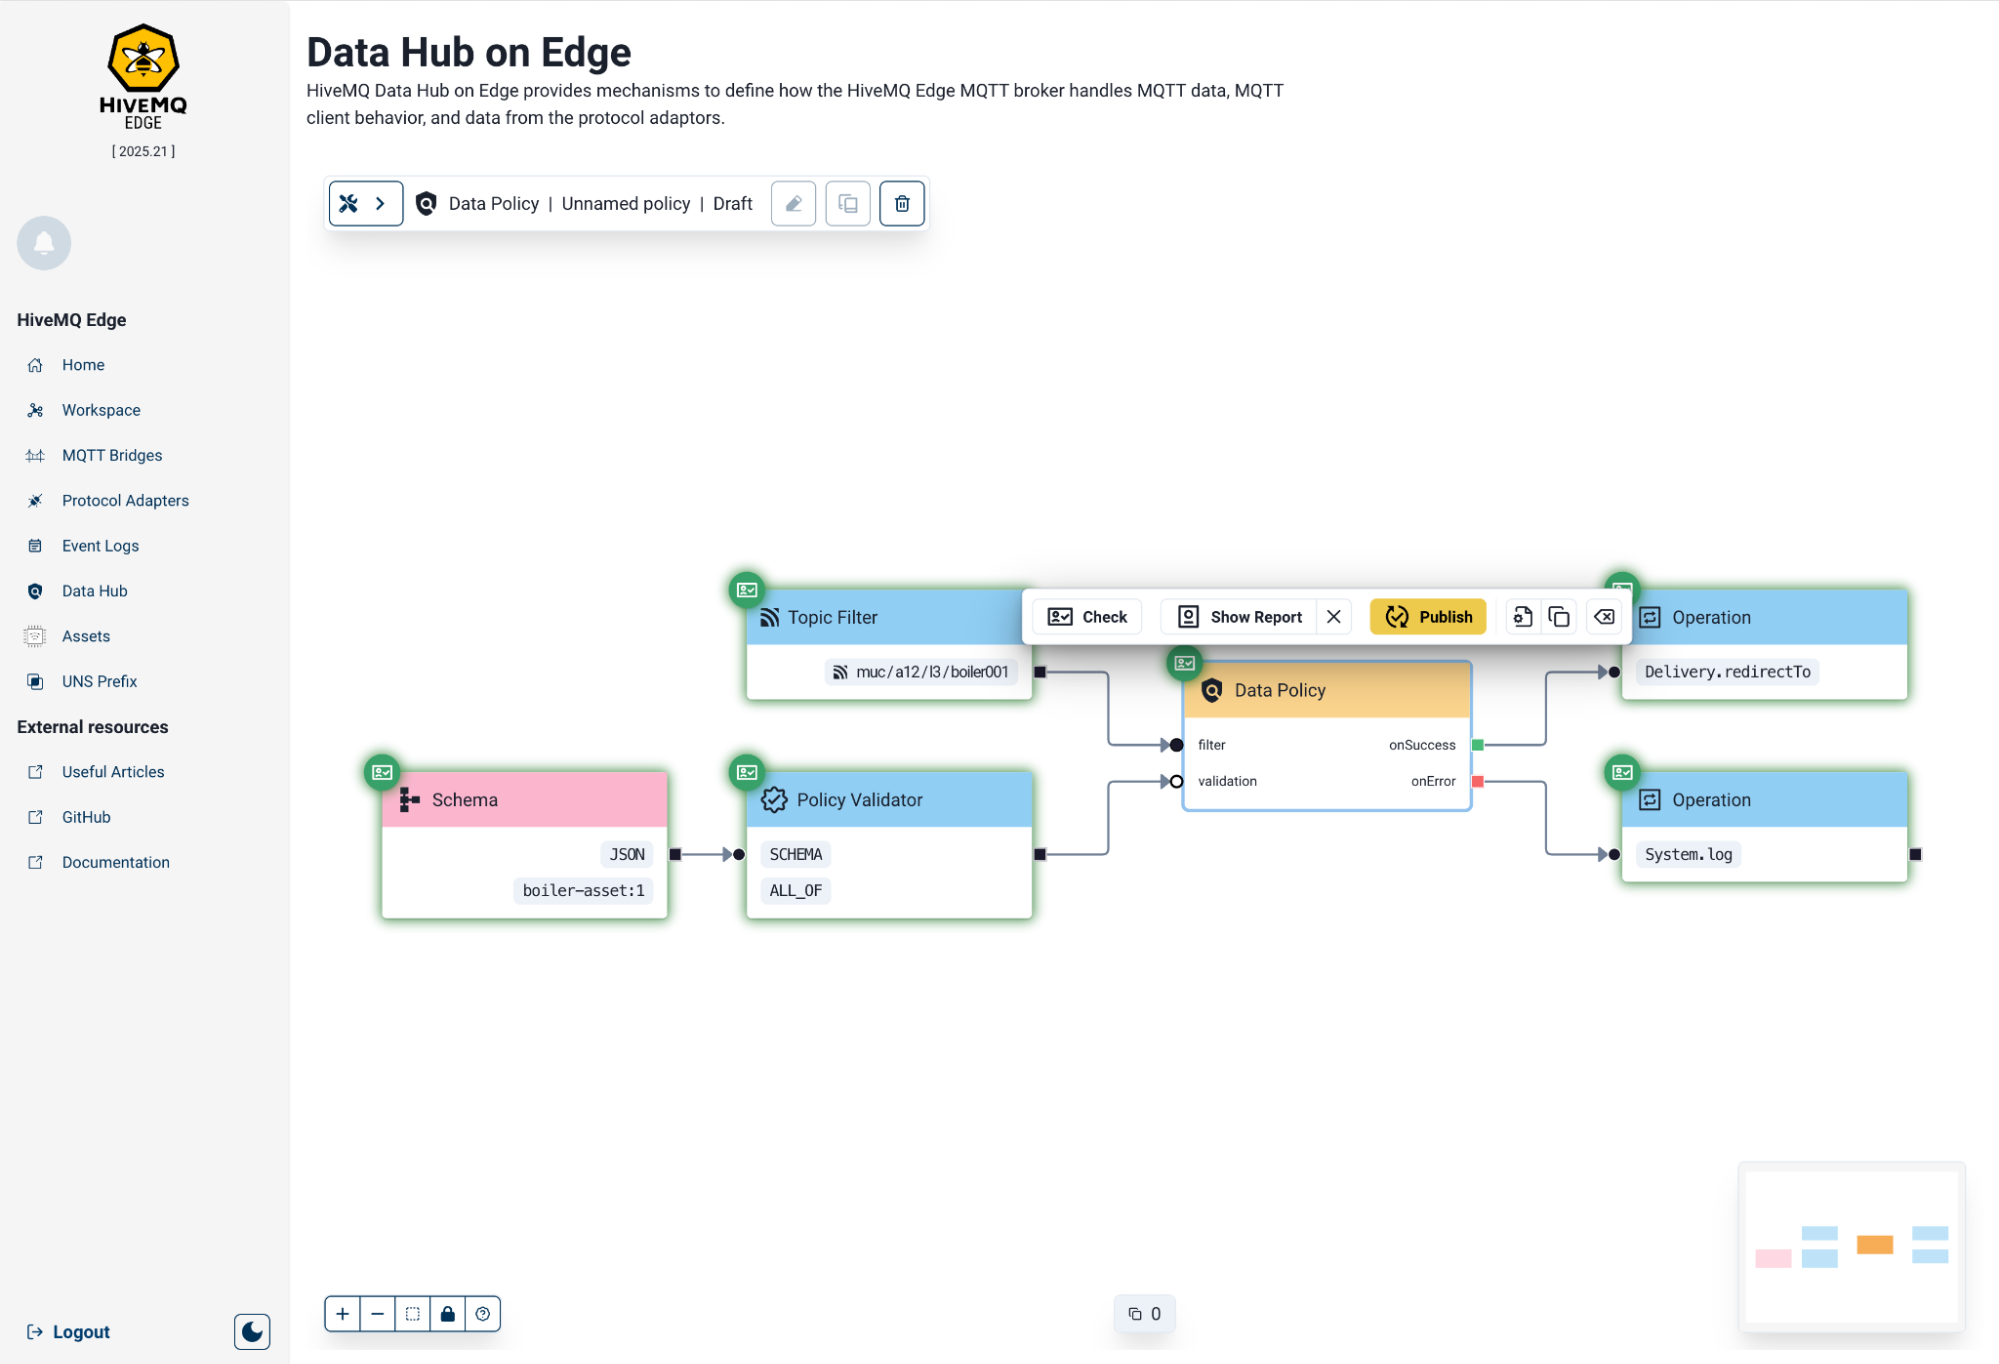
Each node type serves a distinct purpose and must be connected correctly to produce a valid policy workflow. Before you publish a policy, use the Policy Check action to validate the workflow. Each check generates a report to help diagnose any issues.
| To begin building a policy, you must first drag a Data Policy or Behavior Policy node from the Policy Toolbox onto the canvas. |
Data Policy Node
Starts creation of a Data Policy workflow
-
Header: Yellow
-
Options when node selected:
-
Check, initiates a policy workflow validation check
-
Show Report, brings up side-pane with validation report
-
Publish, yellow button becomes available when workflow has successful validation check. Click to publish the policy to Data Hub
-
Configuration:
-
ID, user-defined identifier for the Policy (policy name), mandatory for validation
-
-
Copy, to copy the node and its current configuration
-
Delete, to delete the node and its current configuration
-
-
Inputs:
-
Filter, connect nodes that input topics and client data
-
Validation, connect nodes that enable schema and data validation
-
-
Outputs:
-
onSuccess, connect nodes that enable functions and operations when the data is valid
-
onError, connect nodes that enable functions and operations when the data is invalid
-
Behavior Policy Node
Starts the creation of a Behavior Policy workflow
-
Header: Yellow
-
Options when node selected:
-
Check, initiates a policy workflow validation check
-
Show Report, brings up side-pane with validation report
-
Publish, yellow button becomes available when workflow has successful validation check. Click to publish the policy to Data Hub
-
Configuration:
-
ID, user-defined identifier for the Policy (policy name), mandatory for validation
-
Behavior Model, preselect from:
-
Publish.quota
-
Sub-options: min and maxPublishes, enables users to set the quota size
-
-
Mqtt.events
-
Publish.duplicate
-
-
-
Copy, to copy the node and its current configuration
-
Delete, to delete the node and its current configuration
-
-
Input, connect nodes that input topics and client data
-
Output, connect to nodes that conduct transition, operations and functions
Topic Filter Node
Enables selection of a topic(s) to be used as a variable in the policy workflow
-
Header: Blue
-
Options when node selected:
-
Configuration:
-
Adapter Source, select protocol adapters topics are sourced from (optional)
-
Topic Filters, add one or more topics to the utilise in the policy workflow
-
-
Copy, to copy the node and its current configuration
-
Delete, to delete the node and its current configuration
-
-
Output, connect to data policy nodes
Client Filter Node
Enables selection of a client(s) to be used as a variable in the policy workflow
-
Header: Blue
-
Options when node selected:
-
Configuration:
-
Client Filters, add one or more client identifiers to the utilise in the policy workflow
-
-
Copy, to copy the node and its current configuration
-
Delete, to delete the node and its current configuration
-
-
Output, connect to policy nodes
Policy Validator Node
Enables data validation of JSON and Protobuf schemas within the policy workflow
-
Header: Blue
-
Options when node selected:
-
Configuration:
-
Validator Type, only one option at present 'SCHEMA'
-
Validation Strategy: Select from the following options:
-
ANY_OF, part of the data schema can be relevant
-
ALL_OF, all of the data schema must match
-
-
-
Copy, to copy the node and its current configuration
-
Delete, to delete the node and its current configuration
-
-
Input, schema node
-
Output, connect to data policy node
Schema Node
Enables input of JSON and Protobuf schemas within the policy workflow
-
Header: Blue
-
Options when node selected:
-
Configuration:
-
Select Schema, provides drop down menu to select a pre-existing schema
-
Version: Select which version of the schema to use
-
Schema, displays the schema type (JSON, Protobuf)
-
schemaSource, displays the schema
-
-
Copy, to copy the node and its current configuration
-
Delete, to delete the node and its current configuration
-
-
Output, connect to policy validator node
Transition Node
Allows you to select pre-defined MQTT events to take behavioral policy actions against
-
Header: Blue
-
Options when node selected:
-
Configuration: Model is preselected based on the Behavior Model in use. Options per model as follows
-
Model: Publish.quota (greyed out)
-
Event: Drop down menu appears with a set of event trigger types available related to publishing quotas
-
-
Model: Mqtt.events (greyed out)
-
Event: Drop down menu appears with a set of event trigger types available related to MQTT events
-
-
Model: Publish.duplicate (greyed out)
-
Event: Drop down menu appears with a set of event trigger types available related to publishing duplicate messages
-
-
-
Copy, to copy the node and its current configuration
-
Delete, to delete the node and its current configuration
-
-
Input, schema node
-
Output, connect to data policy node
Operation Node
Allows you to select pre-defined function operations to perform when the input is triggered.
-
Header: Blue
-
Options when node selected:
-
Configuration:
-
ID, user-defined identifier or label for the operation
-
Function, select a pre-defined operation to be carried out on input:
-
System.log, enables user-defined log message to be written to the system log
-
Metrics.Counter.increment, enables users to select an observability metric and set an increment value
-
Delivery.redirectTo, enables users to define a new MQTT topic to publish the payload to and decide is the policy is still active after publishing
-
Mqtt.UserProperties.Add, enables users to add custom MQTT user properties to the payload
-
Mqtt.disconnect, disconnects the MQTT client or terminates the workflow
-
Mqtt.drop, drops the message and users can define a reason to be returned to MQTT5 capable clients
-
DataHub.transform, opens up further input connections to support a JS transformation script:
-
Deserializer, connect to a schema node for use in any deserialization script
-
Functions, connect the JS Function node with supporting script here
-
Serializer, connect to a schema node for use in any serialization script
-
-
-
-
Copy, to copy the node and its current configuration
-
Delete, to delete the node and its current configuration
-
-
Input, data policy node, JS Function node, operation node, schema node (when applicable)
-
Output, connect to operation node
JS Function Node
Enables input of JavaScript functions within the policy workflow
-
Header: Pink
-
Options when node selected:
-
Configuration:
-
Select Function, provides drop down menu to select a pre-existing function scripts
-
Version: Select which version of the function to use
-
Description, displays the user-defined description if available for the selected function
-
Source, displays the function JavaScript
-
-
Copy, to copy the node and its current configuration
-
Delete, to delete the node and its current configuration
-
-
Output, connect to the Functions input of an operation node with the DataHub.transform option selected
Schemas
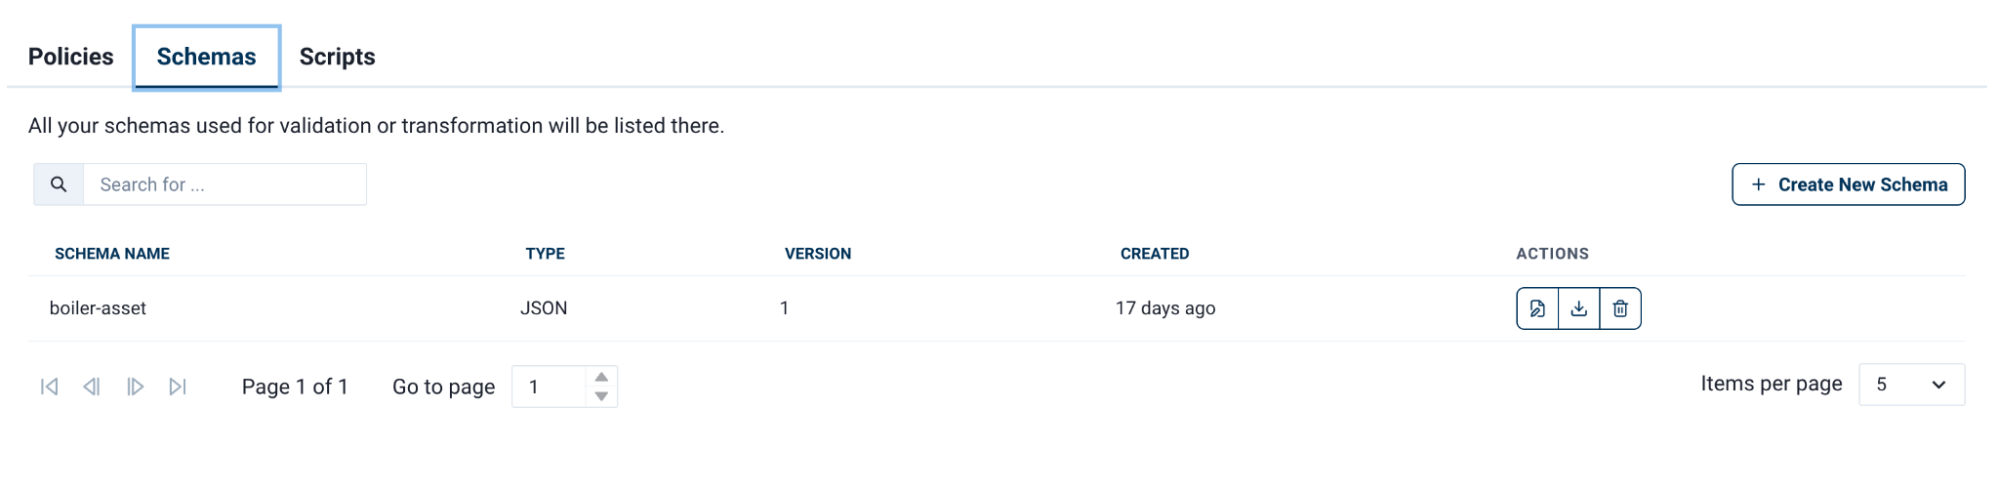
The Schemas tab is where you create and manage the JSON and Protobuf schemas used in data policies.
| Schemas must be created before adding a Schema node to the policy designer. The node only lists schemas that already exist and does not support creating new schemas inline. |
The list view supports Edit, Download, and Delete functions per line item and provides basic information and options to help you navigate and locate schemas.
To create a new schema, select New Schema in the top right corner of the tab.
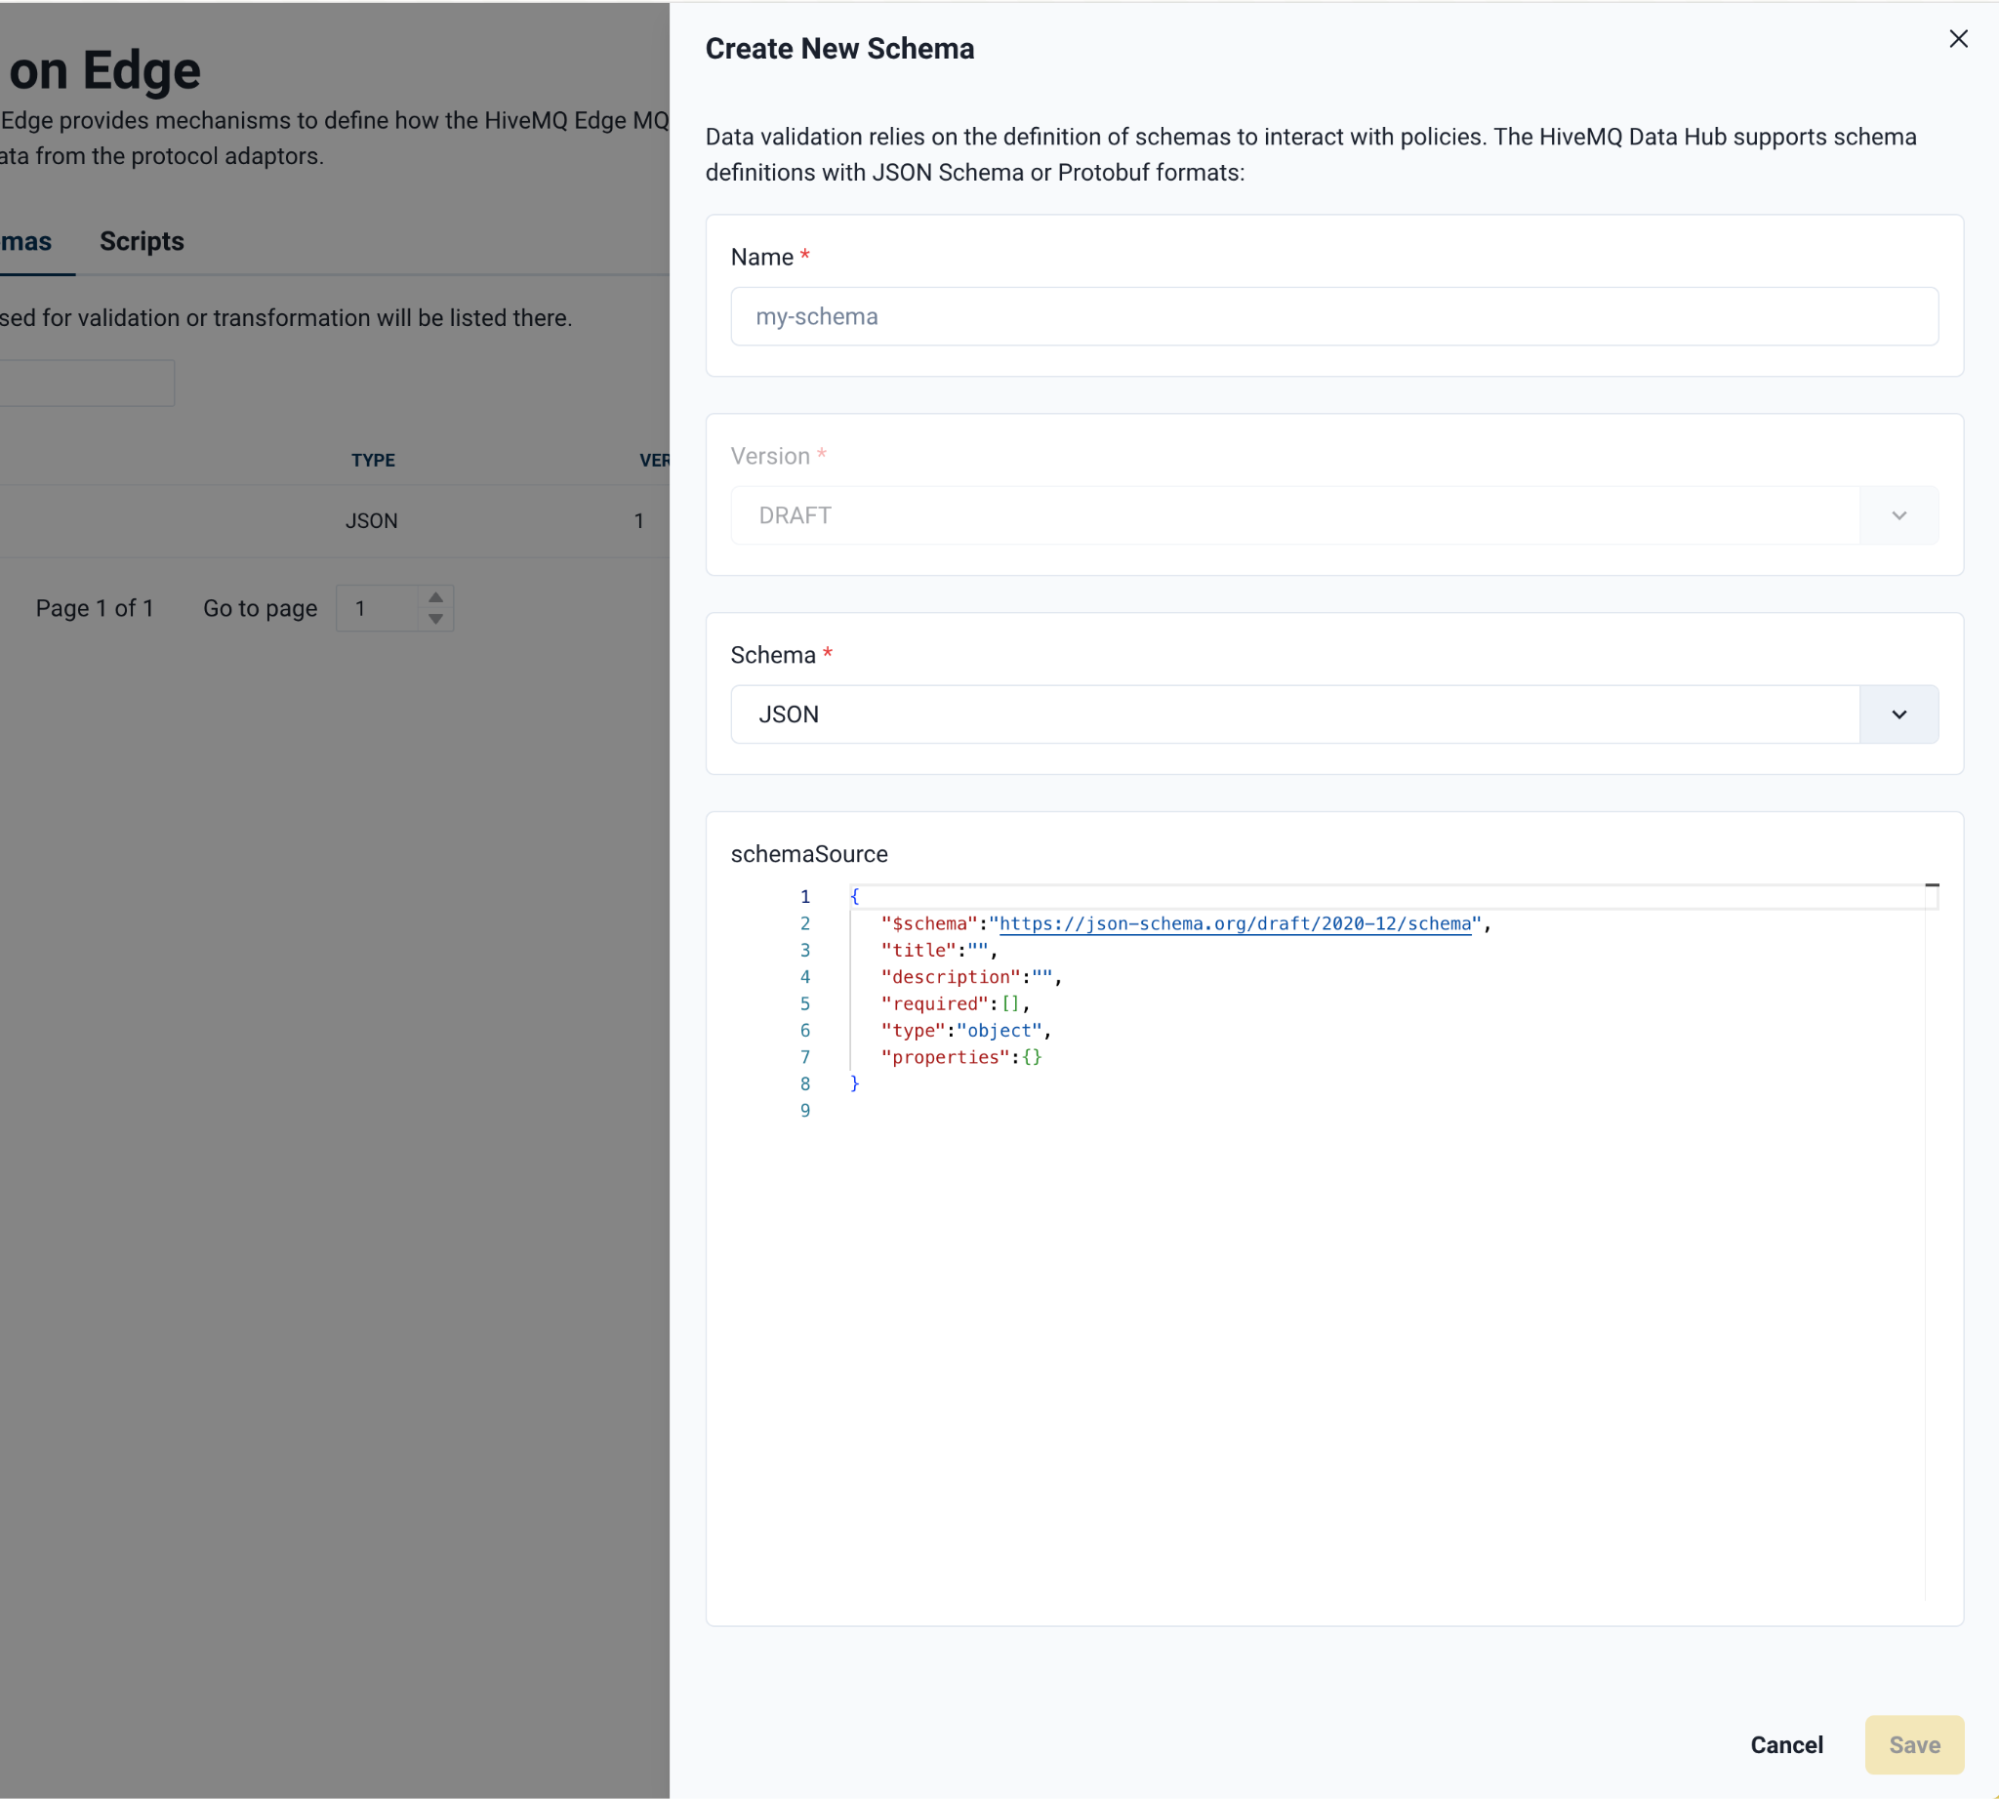
A side panel will emerge with the following fields:
| Field | Description |
|---|---|
Name |
User-defined name for the schema. |
Version |
Multiple versions of the same schema can be stored. Using the same name as an existing schema automatically increments the version number. |
Schema Type |
Schema format. Select either |
Schema Source |
The schema structure. The source can be written directly or pasted from an external source. |
Once the schema is complete, select Save (bottom right) to commit the schema to Data Hub.
Scripts
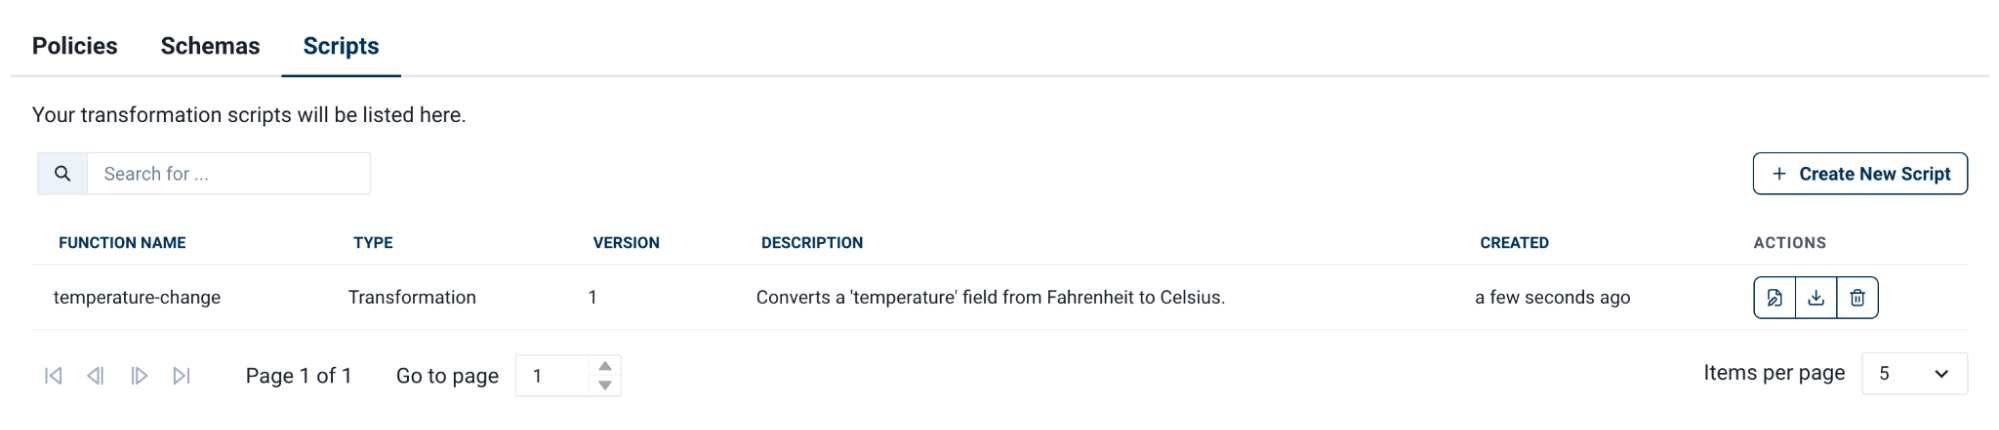
The Scripts tab is where you create and manage the JavaScript function scripts used in data policies.
| Scripts must be created before adding a JS Function node to the policy designer. The node only lists scripts that already exist and does not support creating new scripts inline. |
The list view supports the Edit, Download, and Delete functions per line item and provides basic information and options to help you navigate and locate existing scripts.
To create a new script, select New Script in the top right corner of the tab.
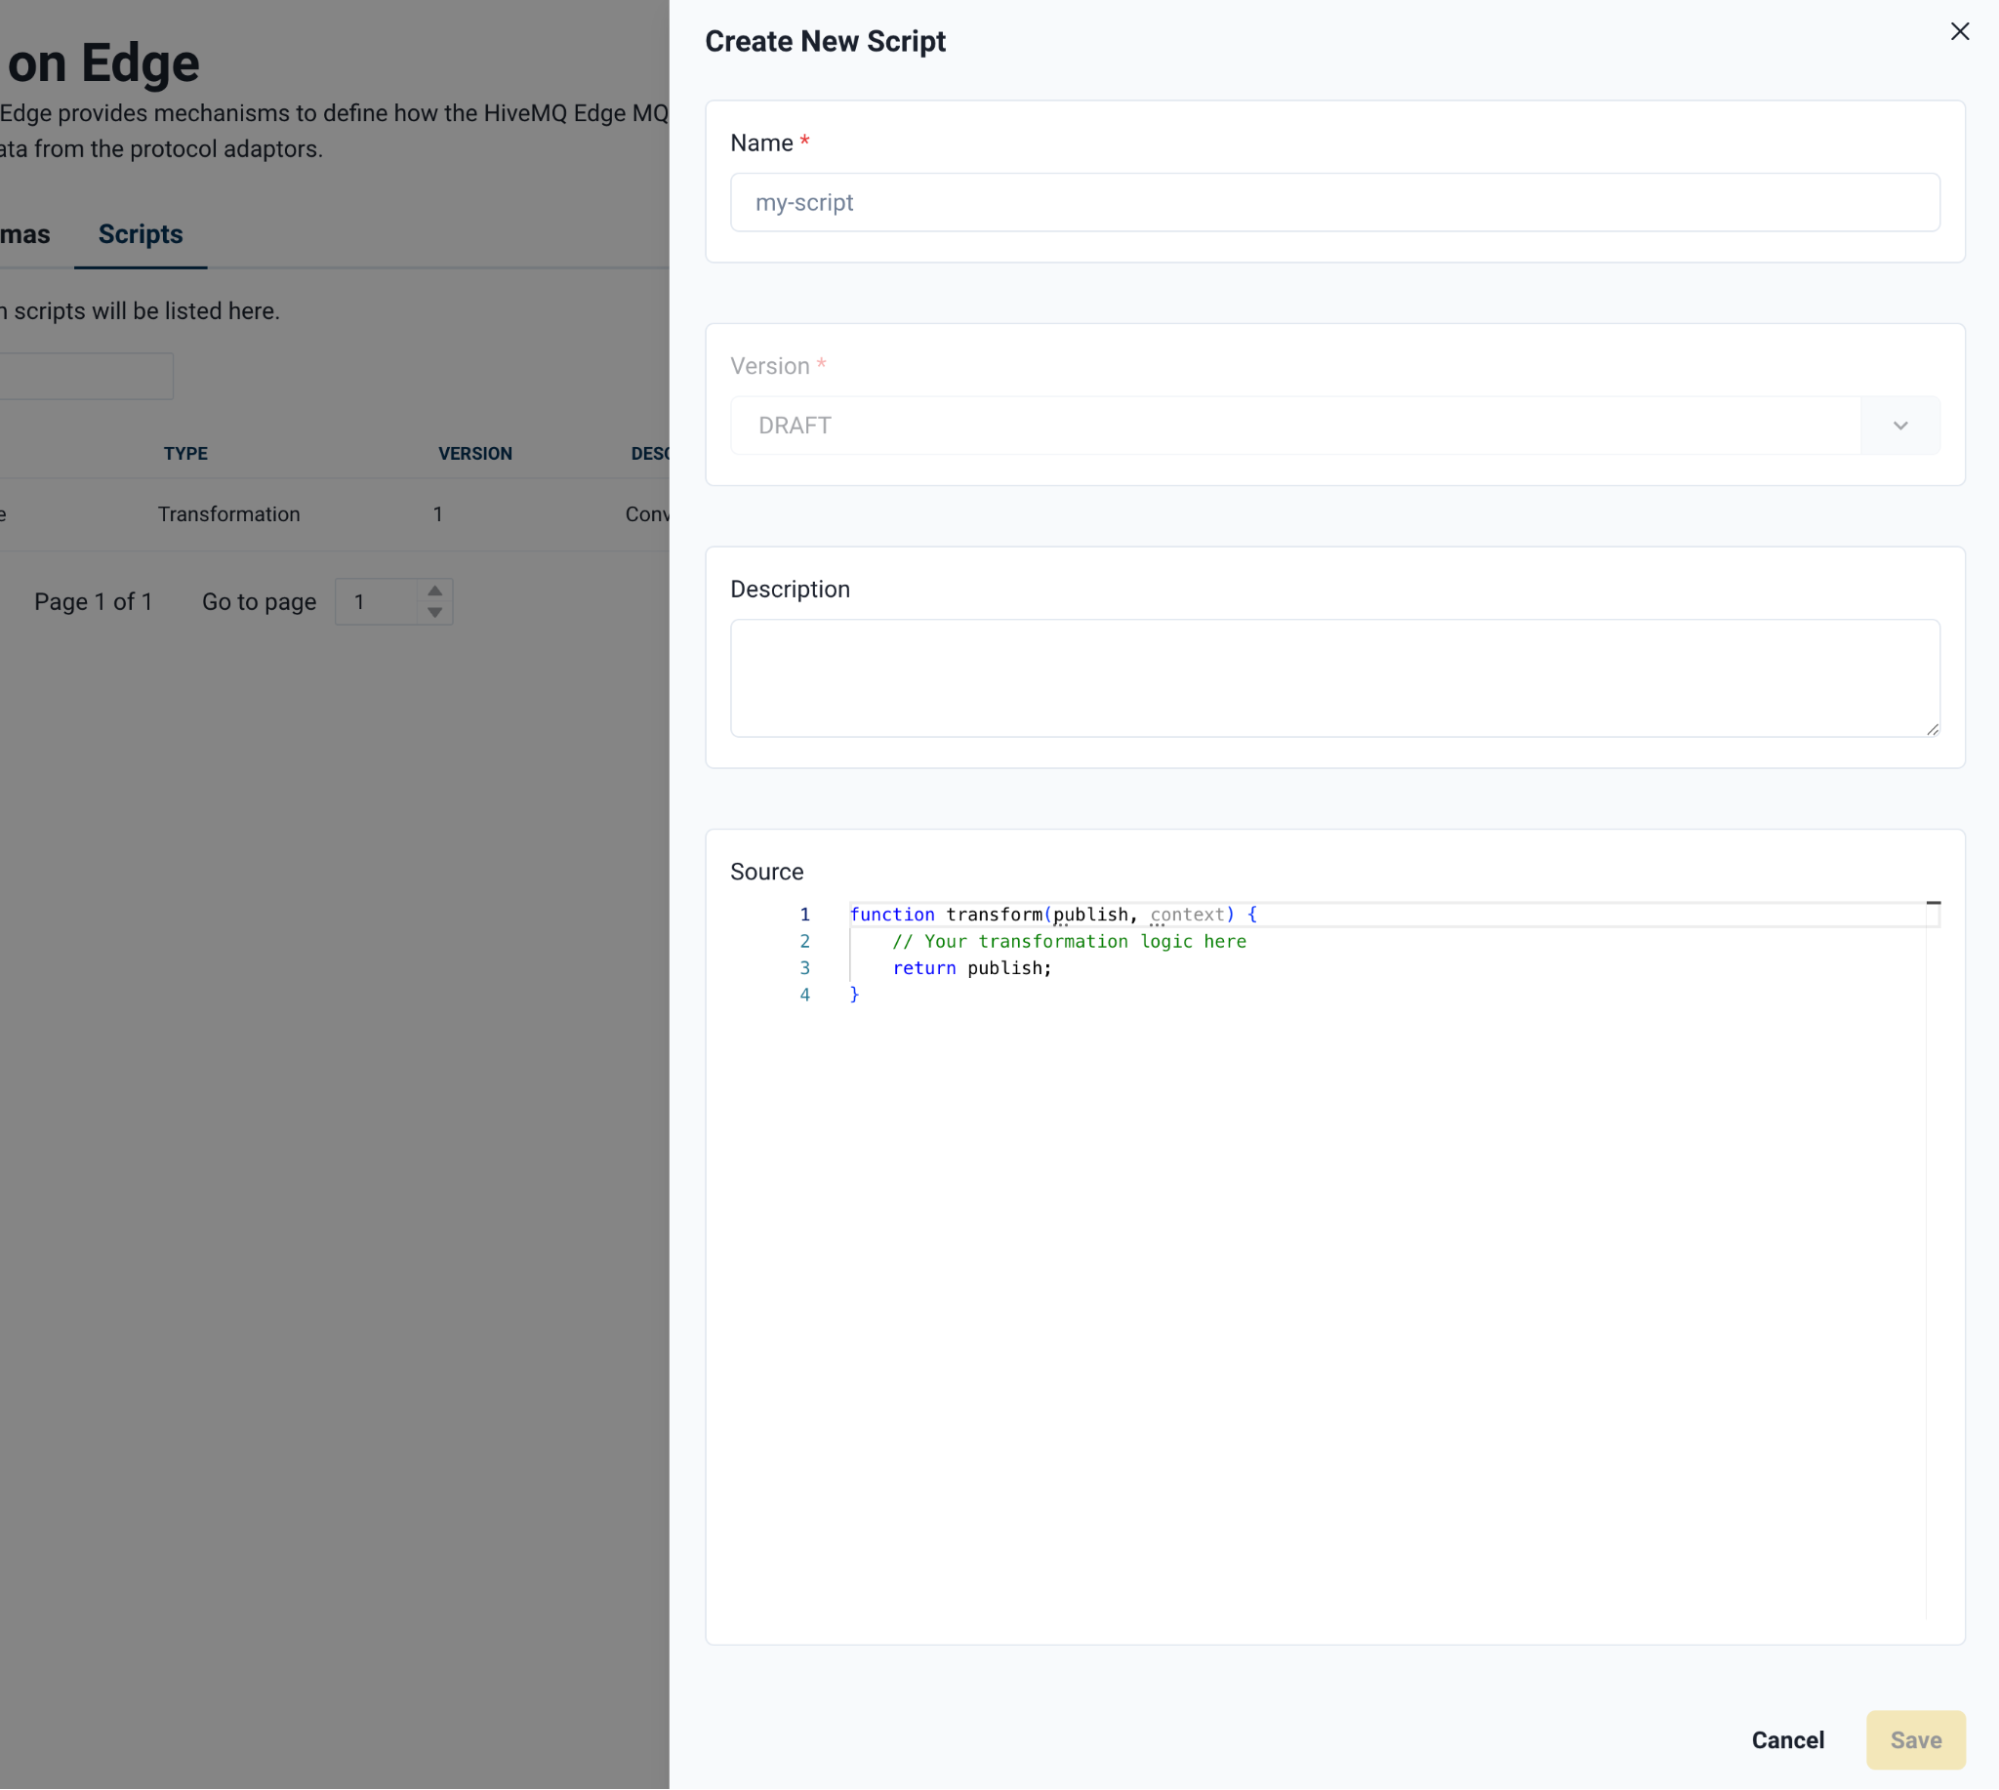
A side panel will emerge with the following fields:
| Column | Description |
|---|---|
Name |
User-defined name for the script. |
Version |
Multiple versions of the same script can be stored. Using the same Name as a existing script automatically generates a new version number. |
Description |
User-defined description of the script. |
Source |
the JavaScript source code. The code can be written directly or pasted from an external source. |
Once the script is complete, click Save (bottom right) to commit the script to Data Hub.
Assets
| Assets only function if the HiveMQ Edge instance has been provisioned to HiveMQ Pulse. |

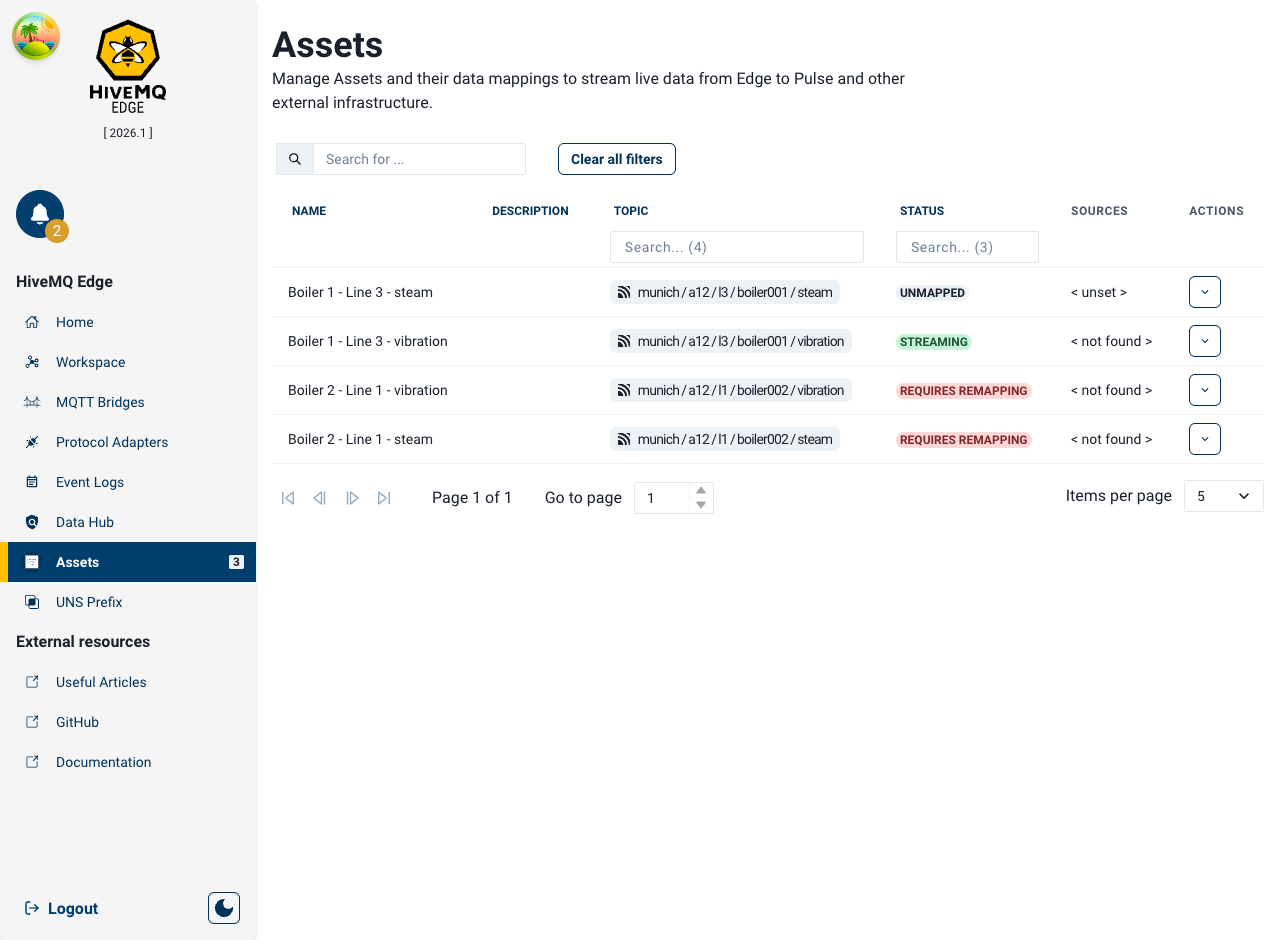
HiveMQ Pulse issues Assets to HiveMQ Edge instances in order to be mapped to create contextualised insights for streaming to Pulse. Once an Asset is distributed to an Edge instance, it appears in the list view under Assets in the main menu.
You can search the list via the search bar at the top or use the column filters for Topic and Status to quickly find Assets based on those criteria. The bottom of the list provides page navigation options and an option to set the number of items per page.
Asset Mapping
Assets that are not yet mapped have Unmapped or Requires Remapping status. To map these assets, select the down arrow on the line item to navigate to the Workspace and begin the mapping workflow.
UNS Prefix

The UNS Prefix function can be configured via the main menu bar, and enables users to set a global UNS prefix to all topics leaving the Edge Broker. Which enables users to set local topic strings to data mapped to the broker and automatically append any MQTT topic leaving the broker via a bridge connection with a user-defined Unified Namespace string. The Edge Console provides an ISA-95 example but users can opt to use as any string format that relates to their business needs, incorporating all of the segments or fewer.
The Enable Unified Namespace slider can be used to toggle the prefix on northbound topics published through a bridge connection between on and off.
To configure the UNS Prefix, click the corresponding yellow button in the top right corner of the view.
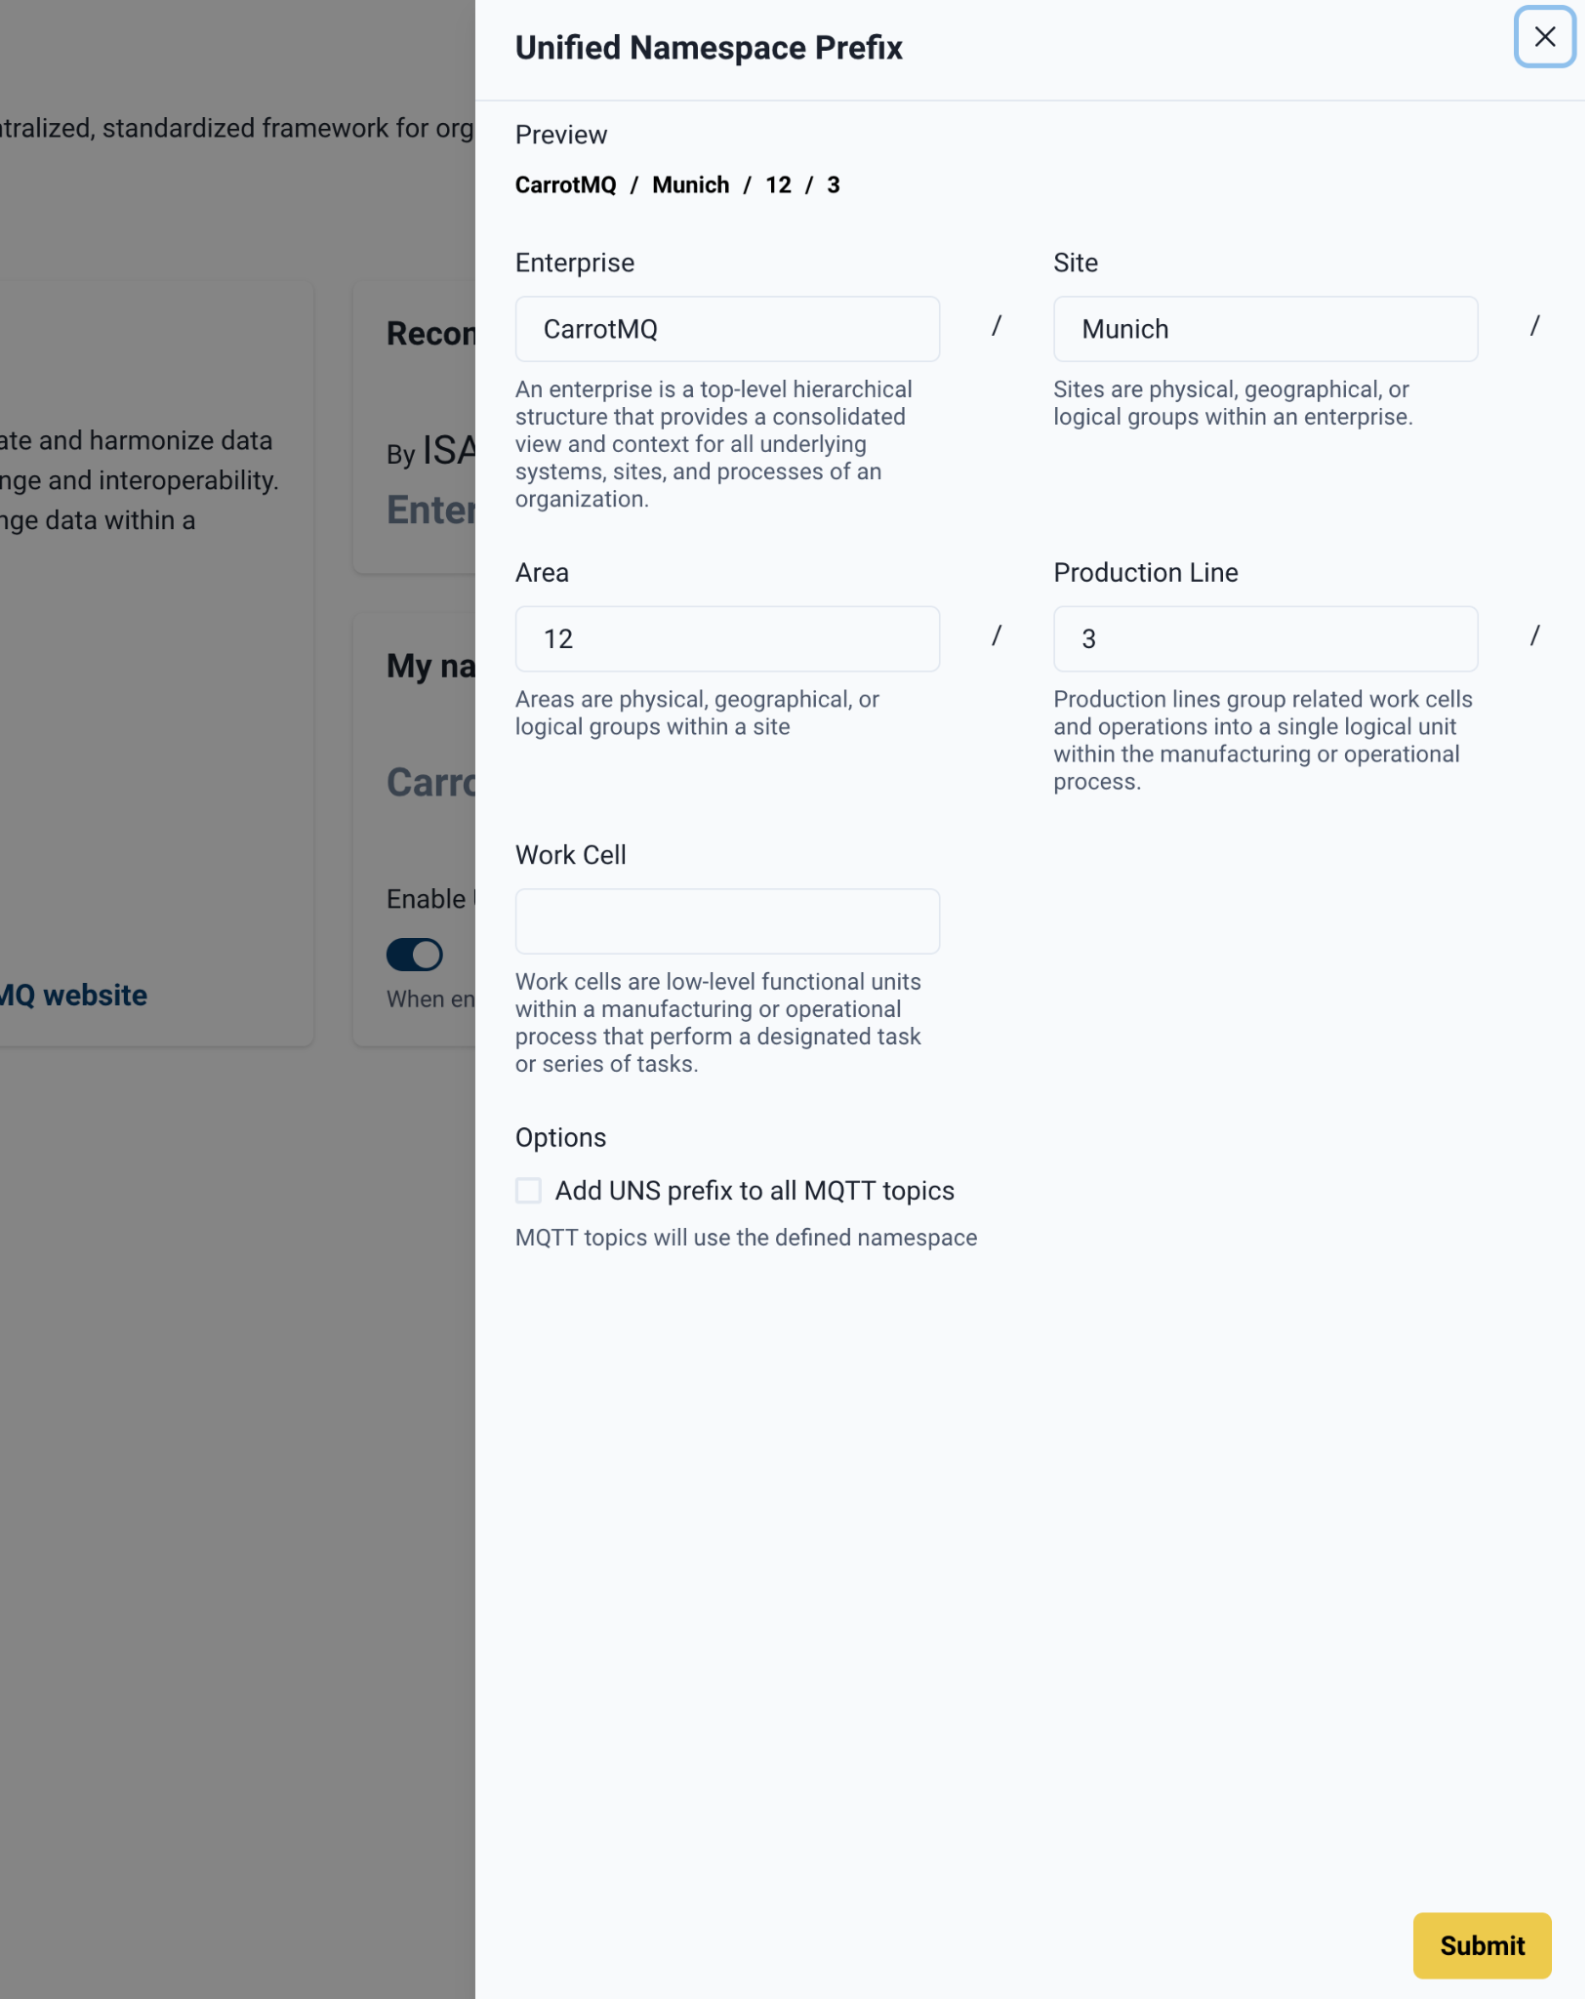
A side panel of Prefix Segments opens. Drag and drop the boxes to rearrange the order or remove segments as needed:
-
Enterprise
-
Site
-
Area
-
Line
-
Cell
Enter values in the text fields for each segment that relates to your UNS requirements. To save the UNS Prefix configuration, click Submit.