Health API
The endpoints of the HiveMQ Health API provide operational information about your HiveMQ broker components and extensions.
With the Health API, you can capture snapshots that show the current state of health for each node in your HiveMQ cluster. The well-structured information the API provides helps you quickly identify potential issues and maintain the smooth operation of your HiveMQ platform deployment.
Configuration
<hivemq>
  <!-- ... -->
  <health-api>
    <enabled>true</enabled>
    <listeners>
      <http>
        <port>8889</port>
        <name>health-api-listener</name>
        <bind-address>127.0.0.1</bind-address>
      </http>
    </listeners>
  </health-api>
</hivemq>| Parameter | Default Value | Required | Description |
|---|---|---|---|
|
|
Enables or disables the use of the HiveMQ Health API. The Health API is disabled by default. To allow access to the Health API, set the |
|
|
Configures one or more HTTP listeners to provide access to the HiveMQ Health API.
|
When the Health API is enabled, multiple endpoints are exposed on each configured HTTP listener:
-
/api/v1/health/: An endpoint that reflects the system-wide health status of all components in the selected HiveMQ deployment. -
/api/v1/health/<component-name>: An endpoint for an individual broker component. -
/api/v1/health/mqtt/<listener-name>: An endpoint for an individual MQTT listener component. -
/api/v1/health/extensions: An endpoint that reflects the health of all extensions in the selected HiveMQ deployment. -
/api/v1/health/extensions/<extension-id>: An endpoint for a individual extension component.
The Health API also provides two health group endpoints that assemble data from sets of components:
-
/api/v1/health/liveness: Liveness Check. -
/api/v1/health/readiness: Readiness Check.
| Health API endpoints are HTTP only and do not support TLS. |
HTTP response
When called, each endpoint of the Health API returns an HTTP status code and a human-readable JSON response body with additional information.
The HTTP status code reflects the overall health of the selected health component or health group.
The response body contains a JSON payload with structured information.
{
  "status": "<status>",
  "details": {
    "<key>": "<value>"
  },
  "components": {
    "<component-name>": {
      "status": "<status>",
      "components": {
        "<component-name>": {
          "status": "<status>",
          "details": {
            "<key>": "value"
          }
        }
      }
    }
  }
}| Based on user feedback and continued development, upcoming versions of the HiveMQ Health API JSON payload are expected to include additional information about the health of individual components. These future additions can change the JSON payload. |
Every health response includes a mandatory status and can optionally include additional details.
|
Health components can have subcomponents that follow the same structure as the component. The status of a component is the aggregated status of all associated subcomponents. This aggregated status of the top (root) component determines the HTTP status code of the response. |
| Status | HTTP status code | Description |
|---|---|---|
|
|
The component is healthy. |
|
|
The health status of the component is unknown. |
|
|
The component is in a degraded state. |
|
|
The service is degraded. |
|
|
The component is not healthy. |
|
|
The service is not available. |
| When you set up automated monitoring and operations, we recommend the use of the Health metrics. If the HTTP endpoints are used, we recommend the use of the HTTP status code only. |
Health Monitoring
Our flexible Health API provides several ways to set up automated monitoring of your HiveMQ Platform.
Health metrics
You can set up automated monitoring and alerting using the Health metrics your HiveMQ Enterprise broker captures.
Prometheus
If you use Prometheus to monitor your HiveMQ Platform metrics, you can leverage the built-in Prometheus alerting features to define alert conditions based on Prometheus expression language expressions and send alert notifications to an external service.
First, define a Prometheus alerting rule to define the conditions in which an alert fires. Using the Health metric values, you can define highly specific rules for a variety of health metrics.
apiVersion: monitoring.coreos.com/v1
kind: PrometheusRule
metadata:
  name: hivemq-platform-health-rules
  namespace: monitoring
  labels:
    release: monitoring-stack
    role: alert-rules
spec:
  groups:
  - name: hivemq-platform-health-alerts
    rules:
    - alert: HiveMQPlatformSystemUnhealthy
      expr: com_hivemq_health_system_current == -1
      for: 5m
      labels:
        severity: warning
      annotations:
        summary: "HiveMQ Platform System Health Check on {{ $labels.instance }} failed"
        description: "The HiveMQ Platform system health is in a DEGRADED state."
    - alert: HiveMQPlatformSystemUnhealthy
      expr: com_hivemq_health_system_current == -2
      for: 30s
      labels:
        severity: critical
      annotations:
        summary: "HiveMQ Platform System Health Check on {{ $labels.instance }} failed"
        description: "The HiveMQ Platform system health is in a DOWN state."
    - alert: HiveMQPlatformExtensionsUnhealthy
      expr: com_hivemq_health_extensions_current < 0
      for: 1m
      labels:
        severity: warning
      annotations:
        summary: "HiveMQ Platform Extension Health Check on {{ $labels.instance }} failed"
        description: "The HiveMQ Platform extension health is in a {{ $value }} state."
Next, you can configure the Prometheus Alertmanager to get notified when a configured alert fires.
global:
  resolve_timeout: 5m

route:
  receiver: slack-notifications
  group_by: ['alertname']
  group_wait: 30s
  group_interval: 5m
  repeat_interval: 1h

receivers:
- name: slack-notifications
  slack_configs:
  - api_url: '<YOUR_SLACK_WEBHOOK_URL>'
    channel: '#alert-notifications'
    text: '{{ range .Alerts }}{{ .Annotations.summary }}\n{{ .Annotations.description }}\n{{ end }}'
    title: '{{ range .Alerts }}{{ .Annotations.summary }}{{ end }}'
    send_resolved: true

# prevents sending a warning notification if a critical alert for the same issue is already active
inhibit_rules:
- source_match:
    severity: 'critical'
  target_match:
    severity: 'warning'
  equal: ['alertname', 'instance']
A degraded health status can be part of normal operations.
For example, when a cluster node is stopped the Cluster health component can be in a DEGRADEAD state to indicate that an ongoing leave replication.
In this scenario the performance might be degraded, and it might be unsafe to shut down more cluster nodes to prevent loss of data that is not yet fully replicated again.
Please configure your alerting rules accordingly to prevent false positive critical alerts for a DEGRADED health status.
|
Kubernetes Probes
Kubernetes has a strict semantic definition of liveness and readiness for Kubernetes containers. The Health API provides ready-to-use endpoints that return the expected HTTP status codes for Kubernetes. For more information, see Liveness Check and Readiness Check.
To manage HiveMQ Platforms in Kubernetes, we recommend using our HiveMQ Platform Operator. Use of the HiveMQ Platform Operator is a convenient way to ensure the correct configuration of your liveness and readiness probes.
If you need to deploy your HiveMQ Platform cluster manually, please use the following Kubernetes probes configuration.
livenessProbe:
  httpGet:
    path: /api/v1/health/liveness
    port: 8889
    scheme: HTTP
  initialDelaySeconds: 15
  periodSeconds: 30
  successThreshold: 1
  failureThreshold: 240
readinessProbe:
  httpGet:
    path: /api/v1/health/readiness
    port: 8889
    scheme: HTTP
  initialDelaySeconds: 3
  periodSeconds: 5
Incorrect configuration of liveness or readiness probes can lead to cascading failures.
Do not build custom queries using the status or details fields of health components for Kubernetes probes.
For example, a DEGRADED component does not indicate that a container must be restarted (liveness check) or is not ready to accept traffic (readiness check).
|
HAProxy
HAProxy is a simple and easy-to-install load balancer. A HAProxy load balancer can distribute incoming MQTT connections to different nodes in your HiveMQ cluster.
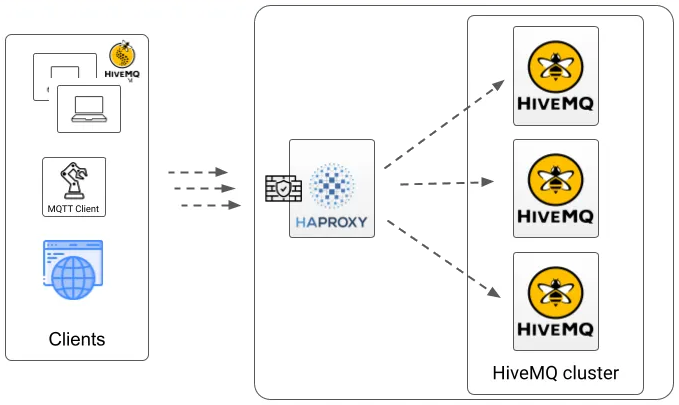
You can configure HAProxy to use the Health API readiness endpoint of your HiveMQ cluster as follows:
haproxy.cfg file using the Health APIglobal
stats socket /var/run/api.sock user haproxy group haproxy mode 660 level admin expose-fd listeners
log stdout format raw local0 info
defaults
log global
mode tcp
option tcplog
maxconn 1024000
timeout connect 30000
timeout client 600s
timeout server 600s
default-server init-addr last,libc,none
frontend stats
mode http
bind *:8404
stats enable
stats uri /stats
stats refresh 10s
stats admin if LOCALHOST
frontend health_frontend
mode tcp
option tcplog
bind *:8889
default_backend health_backend
backend health_backend
mode http
server HMQ1 HMQ-node1:8889
server HMQ2 HMQ-node2:8889
server HMQ3 HMQ-node3:8889
frontend mqtt_frontend
mode tcp
option tcplog
bind *:1883
default_backend mqtt_backend
backend mqtt_backend
mode tcp
stick-table type string len 32 size 100k expire 30m
stick on req.payload(0,0),mqtt_field_value(connect,client_identifier)
option httpchk
http-check send meth GET uri /api/v1/health/readiness
server HMQ1 HMQ-node1:1883 check port 8889
server HMQ2 HMQ-node2:1883 check port 8889
server HMQ3 HMQ-node3:1883 check port 8889The example configures HAProxy to route all incoming MQTT traffic on port 1883 to one of three HiveMQ cluster nodes.
Health checks are enabled for the nodes by adding check port 8889 after each server line in the backend mqtt_backend section.
The lines option httpchk and http-check send meth GET uri /api/v1/health/readiness specify that the health check is performed by accessing the readiness endpoint.
HAProxy periodically sends requests to the defined URI on each node. A response with a 2xx or 3xx HTTP status code indicates to HAProxy that the node is healthy, which the Health API conforms to. All other status codes are considered unhealthy, possibly indicating that the selected node is not yet operational. HAProxy stops routing traffic to unhealthy nodes until the node returns to a healthy status.
| The example configuration is not intended for production use. For more information, see Using HAProxy to Load Balance HiveMQ with the New Health API. |
System Health
The system health endpoint provides an aggregated status of all available health components and health groups.
{
  "status": "UP",
  "components": {
    "<component-name>": {
      "status": "UP"
    },
    "liveness-state": {
      "status": "UP"
    },
    "readiness-state": {
      "status": "UP"
    }
  },
  "groups": [ "liveness", "readiness" ]
}{
"status": "DOWN",
"components": {
"<component-name>": {
"status": "DOWN"
},
"liveness-state": {
"status": "UP"
},
"readiness-state": {
"status": "UP"
}
},
"groups": [ "liveness", "readiness" ]
}Health Components
Health API components help you assess the health and status of various aspects of your HiveMQ deployment.
Info
The Info health component provides general information about the HiveMQ platform.
For example, the HiveMQ version, the current log level, and the epoch timestamp of the node start.
{
  "status": "UP",
  "details": {
    "cpu-count": 10,
    "log-level": "INFO",
    "started-at": 1713945889156,
    "version": "0.0.0"
  }
}
Cluster Service
The Cluster health component provides information about the connection state of your HiveMQ Cluster.
Once inter-broker communication is fully established, the node has successfully joined the cluster, and no leave replications are in progress, the cluster status reports UP.
When the cluster is in an UP state, changes to the cluster topology are safe.
While a node leave replication is in progress, the cluster reports a DEGRADED health status.
DEGRADED health status automatically sets the readiness status of the cluster to DEGRADED_SERVICE.
To prevent potential data loss, do not change the cluster topology while the cluster is in a DEGRADED state.
Nodes in a DEGRADED state remain ready to accept traffic.
We strongly discourage use of the status field for automated monitoring.
For best practices, see Health Monitoring.
The information the Cluster health component provides can help you debug node synchronization. For example, to detect a node that is stuck in the join process or to detect a network split.
{
  "status": "UP",
  "details": {
    "cluster-nodes": [
      "jS3bb",
      "C3P0X",
      "R2D2Y"
    ],
    "cluster-size": 3,
    "is-leave-replication-in-progress": false,
    "node-id": "jS3bb",
    "node-state": "RUNNING"
  }
}{
"status": "DEGRADED",
"details": {
"cluster-nodes": [
"jS3bb",
"C3P0X",
"R2D2Y"
],
"cluster-size": 3,
"is-leave-replication-in-progress": true,
"node-id": "jS3bb",
"node-state": "RUNNING"
}
}{
"status": "DOWN",
"details": {
"cluster-nodes": [
"jS3bb",
"C3P0X",
"R2D2Y"
],
"cluster-size": 3,
"is-leave-replication-in-progress": false,
"node-id": "jS3bb",
"node-state": "JOINING"
}
}MQTT
The MQTT health component provides information about the MQTT listeners and their connection state.
The information the MQTT component provides is useful to ensure that all configured listeners are correctly started and ready to accept traffic.
Failure reasons are provided in the details of each listener component.
If a TLS-related failure occurs, the listener reports a DEGRADED health status.
The failure also sets the readiness status to DEGRADED_SERVICE.
In this state, the TLS connections on the listener can still work since the connection continues to use the previously loaded keystore and truststore.
As long as the old certificates remain valid, the TLS listener can continue to function.
However, if the old certificates become invalid or the node is restarted, the listener can fail.
Immediate action is recommended to ensure the stable operation of your HiveMQ cluster.
Nodes in a DEGRADED state remain ready to accept traffic.
We strongly discourage use of the status field for automated monitoring.
For best practices, see Health Monitoring.
{
  "status": "UP",
  "components": {
    "tcp-listener-1883": {
      "status": "UP",
      "details": {
        "bind-address": "0.0.0.0",
        "is-proxy-protocol-supported": false,
        "is-running": true,
        "port": 1883,
        "type": "TCP Listener"
      }
    },
    "tls-tcp-listener-8883": {
      "status": "UP",
      "details": {
        "bind-address": "0.0.0.0",
        "is-proxy-protocol-supported": false,
        "is-running": true,
        "port": 8883,
        "type": "TCP Listener with TLS"
      }
    }
  }
}{
"status": "DEGRADED",
"components": {
"tcp-listener-1883": {
"status": "UP",
"details": {
"bind-address": "0.0.0.0",
"is-proxy-protocol-supported": false,
"is-running": true,
"port": 1883,
"type": "TCP Listener"
}
},
"tls-tcp-listener-8883": {
"status": "DEGRADED",
"details": {
"bind-address": "0.0.0.0",
"is-proxy-protocol-supported": false,
"is-running": true,
"last-tls-failure": "com.hivemq.security.exception.SslException: Not able to open or read KeyStore '/usr/lib/jvm/11/jre/lib/security/cacerts/keystore.jks' with type 'JKS'",
"port": 8883,
"type": "TCP Listener with TLS"
}
}
}
}{
"status": "DOWN",
"components": {
"tcp-listener-1883": {
"status": "UP",
"details": {
"bind-address": "0.0.0.0",
"is-proxy-protocol-supported": false,
"is-running": true,
"port": 1883,
"type": "TCP Listener"
}
},
"tls-tcp-listener-8883": {
"status": "DOWN",
"details": {
"bind-address": "0.0.0.0",
"is-proxy-protocol-supported": false,
"is-running": false,
"last-failure": "java.io.IOException: Failed to bind to /0.0.0.0:8883",
"port": 8883,
"type": "TCP Listener with TLS"
}
}
}
}Control Center
The Control Center health component provides information about the Control Center. The details show the current Control Center configuration, the state of the Jetty server connector, and failure reasons in the details of each listener component (if applicable).
{
  "status": "UP",
  "details": {
    "default-login-mechanism-enabled": true,
    "enabled": true,
    "max-session-idle-time": 14400
  },
  "components": {
    "control-center-http-listener-8080": {
      "status": "UP",
      "details": {
        "bind-address": "0.0.0.0",
        "is-connector-failed": false,
        "is-connector-open": true,
        "is-connector-running": true,
        "port": 8080
      }
    }
  }
}{
"status": "DOWN",
"details": {
"default-login-mechanism-enabled": true,
"enabled": true,
"max-session-idle-time": 14400
},
"components": {
"control-center-https-listener-8443": {
"status": "DOWN",
"details": {
"bind-address": "0.0.0.0",
"is-connector-failed": false,
"is-connector-open": true,
"is-connector-running": true,
"last-tls-failure": "java.io.IOException: keystore password was incorrect",
"port": 8443
}
}
}
}REST API
The REST API health component provides information about the HiveMQ REST API.
The details show your current REST API configuration, the state of the Jetty server connector, and failure reasons in the details of each listener component (if applicable).
{
  "status": "UP",
  "details": {
    "authentication-enabled": false,
    "enabled": true
  },
  "components": {
    "http-listener-8888": {
      "status": "UP",
      "details": {
        "bind-address": "127.0.0.1",
        "is-connector-failed": false,
        "is-connector-open": true,
        "is-connector-running": true,
        "port": 8888
      }
    },
    "https-listener-8889": {
      "status": "UP",
      "details": {
        "bind-address": "127.0.0.1",
        "is-connector-failed": false,
        "is-connector-open": true,
        "is-connector-running": true,
        "port": 8889
      }
    }
  }
}{
"status": "DOWN",
"details": {
"authentication-enabled": false,
"enabled": true
},
"components": {
"http-listener-8888": {
"status": "DOWN",
"details": {
"bind-address": "127.0.0.1",
"is-connector-failed": false,
"is-connector-open": true,
"is-connector-running": true,
"last-failure": "java.io.IOException: Failed to bind to /0.0.0.0:8888",
"port": 8888
}
},
"https-listener-8889": {
"status": "UP",
"details": {
"bind-address": "127.0.0.1",
"is-connector-failed": false,
"is-connector-open": true,
"is-connector-running": true,
"port": 8889
}
}
}
}Extensions
The Extensions health component provides information about your configured custom and HiveMQ Enterprise extensions.
The details provide the extension metadata. Components provide general insights about an extension and detailed information about runtime and startup failures. For example, specific extension setup details or the reason string when an extension fails to start or the trial mode of a HiveMQ Enterprise Extension expires.
Extensions can report a DEGRADED health status in two scenarios.
When a HiveMQ extension throws an uncaught exception, the HiveMQ broker captures the exception and reports the extension status DEGRADED.
The Health API Extension component provides details about the captured exception.
To ensure the reliable processing of your data, review the details and address any issues as soon as possible.
HiveMQ Enterprise Extensions that support configuration hot-reload functionality can report a DEGRADED state when an invalid configuration is provided at runtime.
In this case, you must resolve the cause of the DEGRADED state before the next restart of the extension or the restart will fail and the extension health will progress into a DOWN state.
Immediate action is recommended to ensure the stable operation of your HiveMQ cluster.
Nodes in a DEGRADED state remain ready to accept traffic.
We strongly discourage use of the status field for automated monitoring.
For best practices, see Health Monitoring.
{
  "status": "UP",
  "details": {
    "author": "HiveMQ",
    "enabled": true,
    "name": "HiveMQ Enterprise Extension for Kafka",
    "priority": 1000,
    "start-priority": 1000,
    "startedAt": 1713949817551,
    "version": "4.28.0"
  },
  "components": {
    "application": {
      "status": "UP",
      "components": {
        "configuration": {
          "status": "UP",
          "details": {
            "kafka-to-mqtt-mappings-count": 1,
            "kafka-to-mqtt-transformers-count": 0,
            "mqtt-to-kafka-mappings-count": 1,
            "mqtt-to-kafka-transformers-count": 0,
            "reloaded-at": 1713949818293
          }
        }
      }
    },
    "internals": {
      "status": "UP",
      "components": {
        "entrypoint": {
          "status": "UP",
          "details": {
            "started-at": 1713949817551
          }
        },
        "license": {
          "status": "UP",
          "details": {
            "is-enterprise": true,
            "is-trial": true,
            "is-trial-expired": false
          }
        },
        "services": {
          "status": "UP"
        },
        "shutdown": {
          "status": "UP",
          "details": {
            "stopped-at": 0
          }
        }
      }
    }
  }
}{
"status": "DEGRADED",
"details": {
"author": "HiveMQ",
"enabled": true,
"name": "HiveMQ Enterprise Extension for Kafka",
"priority": 1000,
"start-priority": 1000,
"startedAt": 1713949817551,
"version": "4.28.0"
},
"components": {
"application": {
"status": "DEGRADED",
"components": {
"configuration": {
"status": "DEGRADED",
"details": {
"kafka-to-mqtt-mappings-count": 1,
"kafka-to-mqtt-transformers-count": 0,
"last-failure": "Invalid configuration",
"mqtt-to-kafka-mappings-count": 1,
"mqtt-to-kafka-transformers-count": 0,
"reloaded-at": 1713949818293
}
}
}
},
"internals": {
"status": "UP",
"components": {
"entrypoint": {
"status": "UP",
"details": {
"started-at": 1713949817551
}
},
"license": {
"status": "UP",
"details": {
"is-enterprise": true,
"is-trial": true,
"is-trial-expired": false
}
},
"services": {
"status": "UP"
},
"shutdown": {
"status": "UP",
"details": {
"stopped-at": 0
}
}
}
}
}
}{
"status": "DOWN",
"details": {
"author": "HiveMQ",
"enabled": false,
"name": "HiveMQ Enterprise Extension for Kafka",
"priority": 1000,
"start-priority": 1000,
"startedAt": 1713949817551,
"version": "4.28.0"
},
"components": {
"internals": {
"status": "DOWN",
"components": {
"entrypoint": {
"status": "DOWN",
"details": {
"last-startup-failure": "Extension startup prevented because of the following error: java.nio.file.NoSuchFileException: /opt/hivemq/extensions/hivemq-kafka-extension/conf/config.xml",
"started-at": 1713949817551
}
},
"license": {
"status": "UP",
"details": {
"is-enterprise": true,
"is-trial": true,
"is-trial-expired": false
}
},
"services": {
"status": "UP"
},
"shutdown": {
"status": "UP",
"details": {
"stopped-at": 0
}
}
}
}
}
}Health Groups
It is sometimes useful to organize health components into groups that can be used for different purposes.
Health groups show the aggregated state of selected health components.
The HiveMQ liveness and readiness health groups are useful for common use cases such as
liveness and readiness probes for Kubernetes containers.
For more information, see Kubernetes Probes.
Liveness Check
The liveness health group checks whether the deployed HiveMQ broker is currently operational, responsive, and reachable.
{ "status": "UP" }Readiness Check
The Readiness health group checks whether the HiveMQ node is currently available to receive and process MQTT messages.
If the Cluster component and the MQTT component are both healthy, the readiness check returns the status UP and the node can accept traffic.
If one of the components in the Readiness health group is degraded, the readiness check returns the status DEGRADED_SERVICE.
The degraded service status indicates that the HiveMQ node is still operational, but might fail over time or on the next restart.
Immediate action is recommended to ensure the stable operation of your HiveMQ cluster.
Nodes in a DEGRADED_SERVICE state remain ready to accept traffic.
We strongly discourage use of the status field for automated monitoring.
For best practices, see Health Monitoring.
If one of the components in the Readiness health group is not healthy, the readiness check returns the status OUT_OF_SERVICE.
The out-of-service status indicates that the HiveMQ node is currently unable to accept traffic.
{
  "status": "UP",
  "components": {
    "cluster": {
      "status": "UP",
      "details": {
      }
    },
    "mqtt": {
      "status": "UP",
      "components": {
      }
    }
  }
}{
"status": "OUT_OF_SERVICE",
"components": {
"cluster": {
"status": "UP",
"details": {
}
},
"mqtt": {
"status": "DOWN",
"components": {
}
}
}
}